


Use a real-world dataset to display different methods for dataset slice and select
In this article, we will learn how to slice a Dataframe and select the columns and the rows and the slice using Python Pandas package. We will use the cleaned dataset gdp_china_outlier_treated.csv, which can be downloaded from my GitHub repository by clicking this link. I suggest you creating a data folder in your working directory, and moving the downloaded dataset in this folder.
If you are not familiar with the process of data cleaning, you are recommended reading the articles on data cleaning process, including variables rename, missing values detection and missing values imputation, as well as outliers detection and treatment.
First, let’s read the dataset from the data folder in the working directory in Pandas’ DataFrame, or read the dataset from GitHub directly using the method introduced in a previous article.
# Load the required packages
import pandas as pd
# Read the data
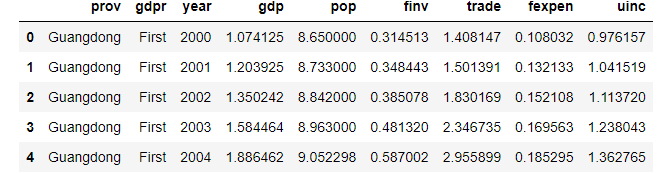
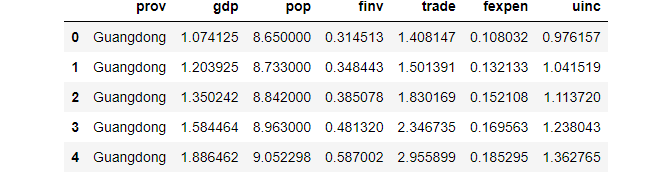
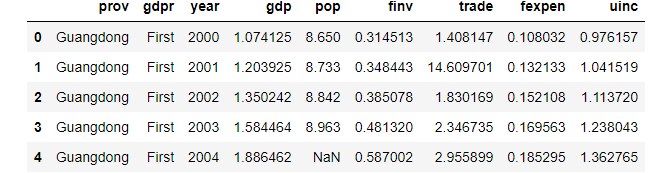
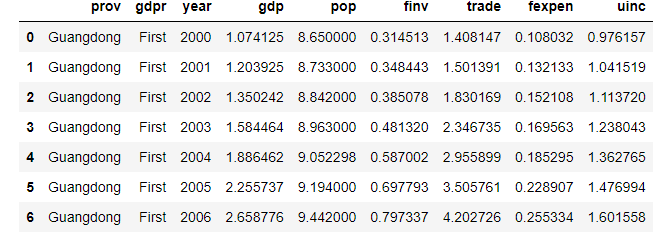
df = pd.read_csv('./data/gdp_china_outlier_treated.csv')
# diplay the first 5 rows
df.head()
1. Selecting columns
let’s see how to select certain columns.
(1) One column
Method 1: Use column name to subset the data frame
gdp = df[['gdp']]
gdp.head()

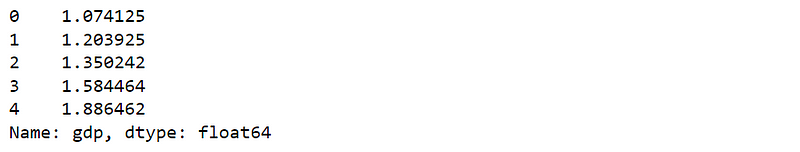
Method 2: Use the column name as an attribute
gdp = df.gdp
gdp.head()
However, sometime this method causes error. For example:
pop = df.pop
pop.head()
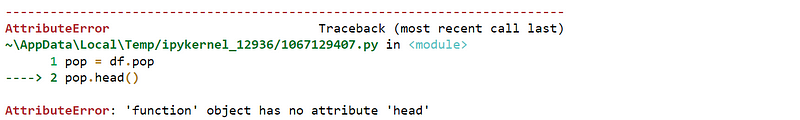
The reason for this error is that it conflicts with the built-in function of pop() in Python.
(2) Select multiple columns
Let’s see how to select multiple columns.
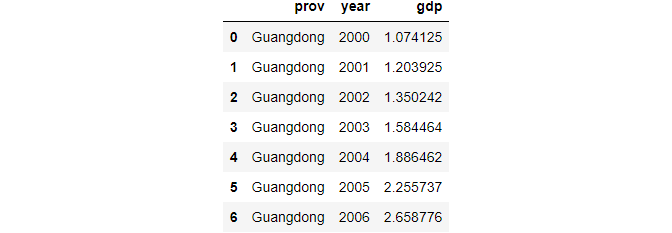
Method 1: using a name list
df_new = df[['prov','year','gdp']]
df_new.head()

Method 2: using drop() function
We can use drop() when selecting multiple columns, except one or certain rows.
(i) Select all columns except one
We select all columns except only year.
df_new = df.drop('year',axis=1)
df_new.head()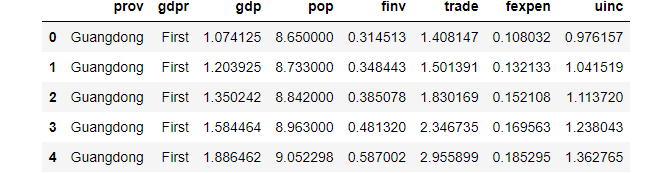
(ii) select all columns except two or more
We select all columns except year and gdpr.
df_new = df.drop(['year','gdpr'],axis=1)
df_new.head()
3. Select rows
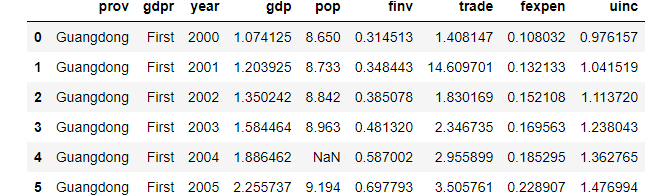
(1) select first N rows
df.head(6)
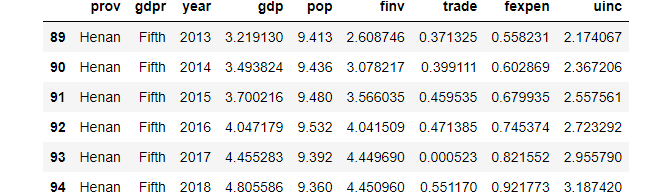
(2) select last N rows
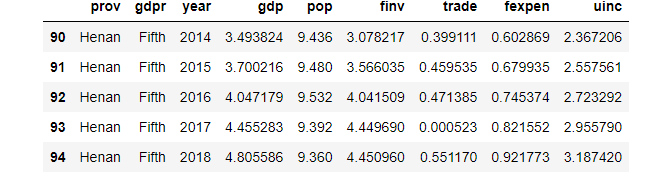
df.tail(6)
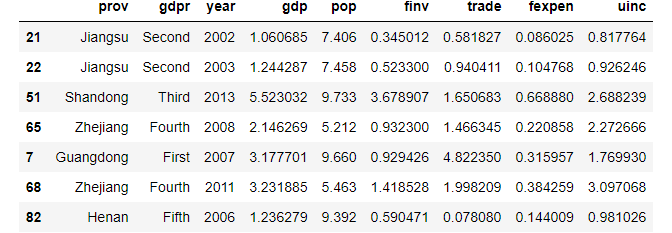
(3) randomly select N rows
df.sample(7)
(4) using row index
For example, select the first 5 rows
df[0:5]
# equal to df.head()
Select last five rows.
df[-5:]
#equal to df.tail()
(5) using drop() function
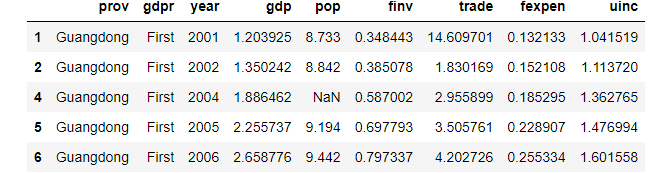
For example, drop rows at the indexes of 0 and 3.
df_new = df.drop([0,3],axis=0)
df_new.head()
(6) using .loc indexer
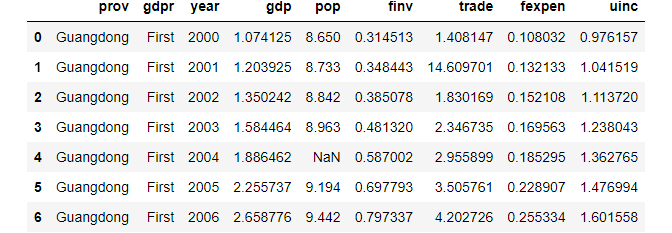
For example, select the first to the seventh rows.
df.loc[0:6]
(7) using .iloc indexer
To select the first 7 rows, we can do the following:
df.iloc[0:7]
4. Slicing rows and columns
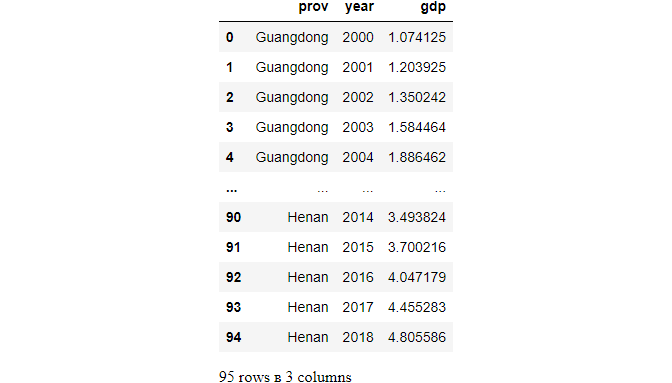
(1) using .loc
We can use the row index and the column names.
df.loc[0:6,['prov','year','gdp']]
# all rows
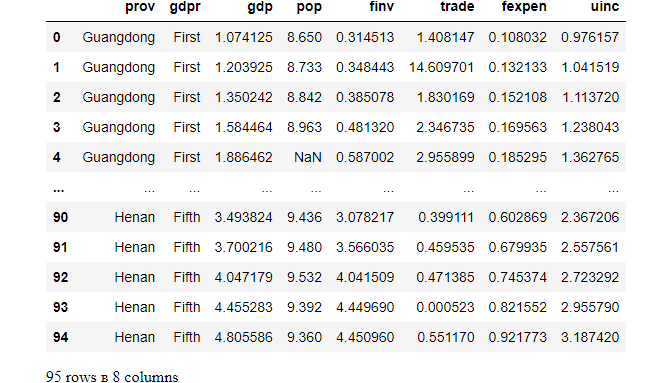
df.loc[:,['prov','year','gdp']]
# exclude one column
df.loc[:,df.columns!='year']
(2) using .iloc
# continous columns
df.iloc[0:6,0:4]

# discontinuous columns
df.iloc[0:6,[0,2,4]]

5. Difference between loc and iloc
The main difference between loc indexer iloc indexer are as follows:
loc: label-based, which specify rows and columns based on their row and column labels.iloc: integer position-based, which specify rows and columns by their integer position values (0-based integer position).
6. Online course
If you are interested in learning data analysis in details, you are welcome to enroll one of my course:
Master Python Data Analysis and Modelling Essentials