

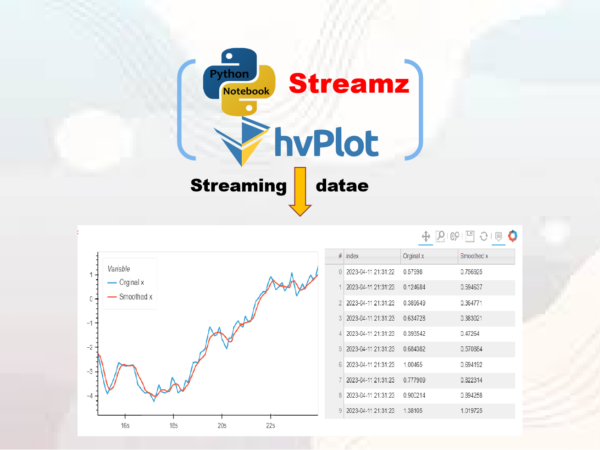
Using Streamz to generate streaming data and hvPlot to visualize the streaming data in time
Streaming, living or real-time data plotting is important because it allows us to visualize and analyze data as it is being generated, enabling us to monitor and respond to changes or trends in real-time. This is particularly useful in applications where data is generated continuously, such as in scientific experiments, financial trading, or IoT (Internet of Things) devices.
Streaming data plotting allows us to:
- Identify patterns and anomalies: By visualizing data in real-time, we can quickly identify patterns, trends, and anomalies as they occur, enabling us to take action or adjust our approach accordingly.
- Make informed decisions: Real-time data plotting provides us with up-to-date information that can inform our decision-making, such as when to buy or sell stocks, when to adjust the parameters of an experiment, or when to adjust the settings of a machine.
- Improve efficiency and productivity: Real-time data plotting can help us optimize processes and workflows, enabling us to detect and address issues before they become bigger problems, and ultimately improving efficiency and productivity.
- Enable rapid prototyping and testing: Real-time data plotting can be useful in rapid prototyping and testing, allowing us to quickly iterate on ideas and test them in real-time.
Overall, streaming data plotting is a powerful tool that can help us make informed decisions, improve efficiency, and drive innovation in a variety of fields.
1. Install Libraries
We need to install hvPlot and Streamz. In the previous article, it has displayed how to install hvPlot. You can read that article to see the installation of hvPlot if you have installed it on your computer. Here, we just show how to install Streamz as follows.
To install either using conda-forge:
conda install streamz -c conda-forgeor using pip:
pip install streamz2. Basic plot
(1) Generate Real-time Data
We can easily use streamz to generate some random real-time dataset.
import hvplot.streamz
from streamz.dataframe import Random

df = Random(freq='60ms',interval='200ms')
df
(2) Basic streaming plot
Next, we just create interactive plot using hvPlot. For example, we create a simple line plot.
df.hvplot()
(3) Stop streaming
We can stop the streaming with:
In [3]:
df.stop()
3. Dask integration
Dask is a parallel computing library that uses Tornado for concurrency and threads for computation. The DaskStream object is a drop-in replacement for Stream (mostly). Typically we create a Dask client, and then scatter a local Stream to become a DaskStream.
(1) Start a Dask client
from dask.distributed import Client
client = Client()
client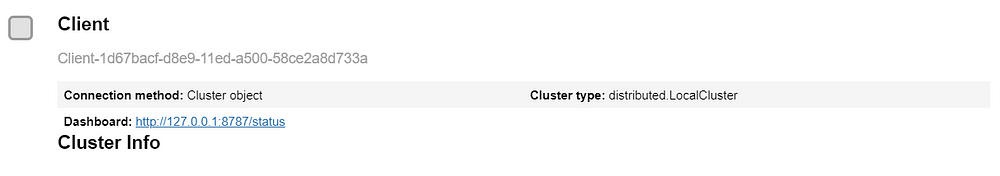
Click the Dashboard link to open the Dask Dashboard.
(2) Generate random data
In [4]:
from streamz.dataframe import Random,DataFrame

source = Random(freq='100ms',interval='200ms',dask=True)
sdf = (source - 0.5).cumsum()

sdf.tail()
The Dask Dashboard like:
(3) Create a new DataFrame
We create a new DataFrame, which includes the original x and the smoothed x.
p = DataFrame({'Orginal x':sdf.x,
               'Smoothed x':sdf.x.rolling('300ms').mean()})
p
(4) Outlay plots
We create a plot of the original x and smooth x.
import hvplot.streamz

p.hvplot(width=500,legend='top_left') + p.hvplot.table(width=400, backlog=10)
4. Conclusions
Streaming data plotting is import to visualize the real-time date. We can easily simulate streaming data using Streamz and hvPlot, in which Streamz can help us easily generate streaming data and then hvPlot can be used to directly visualize these streaming data. Besides, Dask client can also conveniently be integrated into the Streamz streaming data visualization.