

Display how to apply stepwise regression with a concrete real-world example
Stepwise regression is a very helpful approach to select the statistic significant predictors in a traditional regression model. In a previous post, Stepwise regression has been generally introduced. I suggest you glancing over that post first before read this post if you are not familiar with stepwise regression. In this post, my focus is to introduce a stepwise regression package in Python and display how to use it to a concrete real-world dataset. This package can help you avoid many tedious and iterative works to examine if each of the features is statistical significance during model development.
1. Install the packages
This package is called stepwise-regression, and you can go to its home page in GitHub to see details and the source code.
First, let’s install it using pip from PyPI.
pip install stepwise-regression
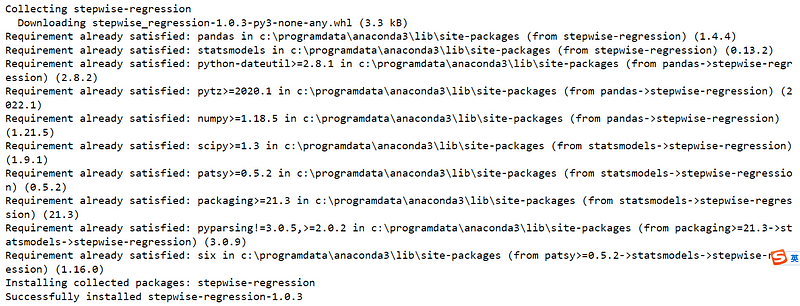
The last line shows that the stepwise-regression package version 1.0.3 has been successfully installed.
2. Use it for a real-world example
(1) Import the required packages
Now, let’s import the required packages. Besides, stepwise-regression package, we also need Pandas and Statsmodels.
import pandas as pd
import statsmodels.api as sm
from stepwise_regression import step_reg
(2) Read the data
You can download the data in GitHub through this linkage, and then read the data from your local working directory. But here we read the data directly from the GitHub. If you are not familiar with how to read data from GitHub, you can go to one of my previous posts on this topic.
url = ‘https://raw.githubusercontent.com/Sid-149/Life-Expectancy-Predictor-Comparative-Analysis/main/Notebooks/Life%20Expectancy%20Data.csv'
df = pd.read_csv(url,index_col=False)
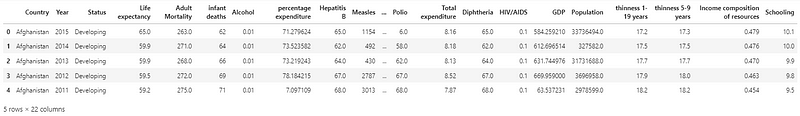
df.head()
(3) Missing data imputation
In a previous post, detailed methods on missing value detection and imputation have been discussed. Here, we just see if there are missing values in data and impute them before using the packages, or there will be an error message if there is missing data.
missings = df.isna().sum().sum()
print(f'Missings:{missings}')
Missings:2563
So there are 2563 missing values in the dataset. Next, we impute them using linear interpolation.
df_impute =df.interpolate(method='linear')
(4) Stepwise regression using the packages
In this example, we will create a model to predict Life expectancy. Then we slice the data into independent variables and dependent variables. We also drop the string/categorical variables from independent variables because the aim of this post is to see how to use the packages to do stepwise regression. If you are looking for methods to encode them and include them in your model, you can read this post.
X = df_impute.drop(['Country','Status','Life expectancy'],axis=1)
y = df_impute['Life expectancy']
(I) Whole model with all predictors
Before using the packages, we create a linear regression model included all the selected variables.
# add a constant
X = sm.add_constant(X)

# define the model and fit it
model = sm.OLS(y, X)

results = model.fit()
To display the OSL results, type:
results.summary()
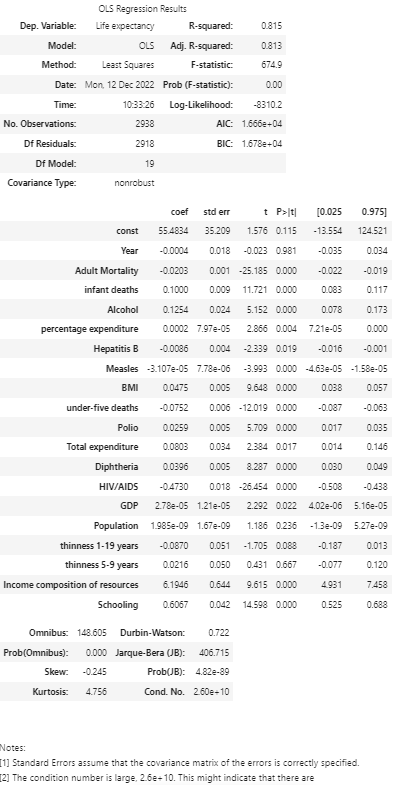
From p-values, we can see Year, Population, thinness 1–19 years and thinness 5–9 years are statistically insignificant at the significant level of 0.05.
Next, let’s see if we can use the package to help us select the feature variables.
(II) Stepwise-regression model
There are two functions, namely backward_regression and forward_regression. There are four parameters in the functions.
X: the independent variables
y:the dependent variable
threshold_in: the threshold value set for p-value, normally 0.05
verbose: the default is False
(a) Backward selection method
Now, let’s see the backward regression.
backselect = step_reg.backward_regression(X, y, 0.05,verbose=False)
backselect
The backward selected predictors including the constant are 17 factors.
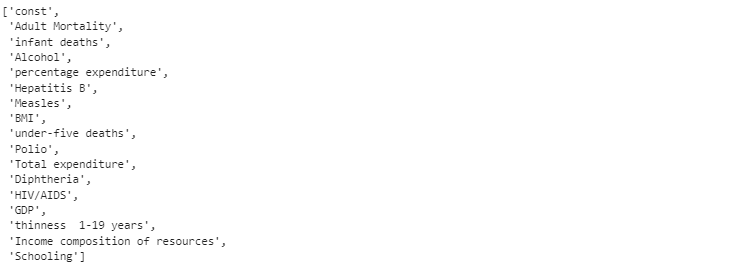
Next, let’s create a linear regression to check if the all the predictors are significant at level of 0.05.
# add a constant
X_backselect = sm.add_constant(X_backselect)

# define the model and fit it
backmodel = sm.OLS(y, X_backselect)

backres = backmodel.fit()

backres.summary()
The OSL results are as follows:
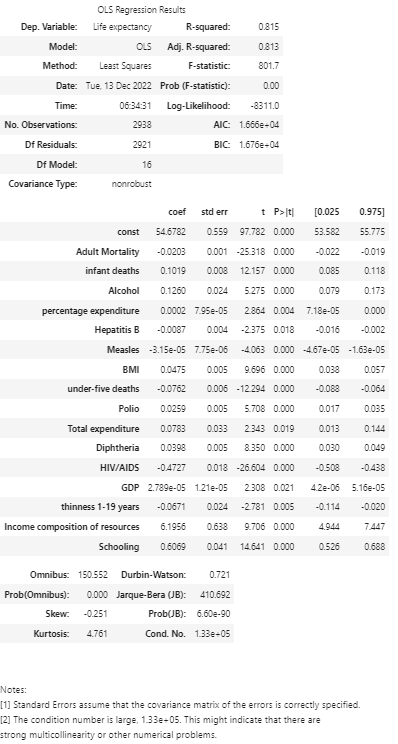
From the above results, we can see that all p-values are less or equal to 0.05, which indicates all the selected predictors are statistically significant at the level of 0.05.
(b) Forward selection method
Now let’s check the forward_regression function of this package. The function parameters are the same with its backward_regression.
forwardselect = step_reg.forward_regression(X, y, 0.05,verbose=False)
forwardselect
The forward selected features including the constant are:
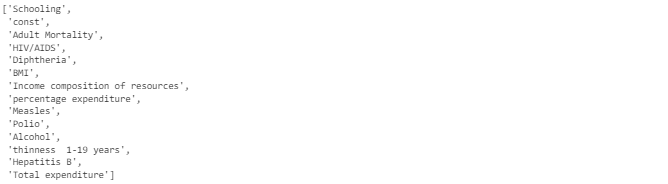
Compared with the backward selection method, the predictors selected by forward method has only 14 factors. Let’s create a model based on these 14 factors and examine its results.
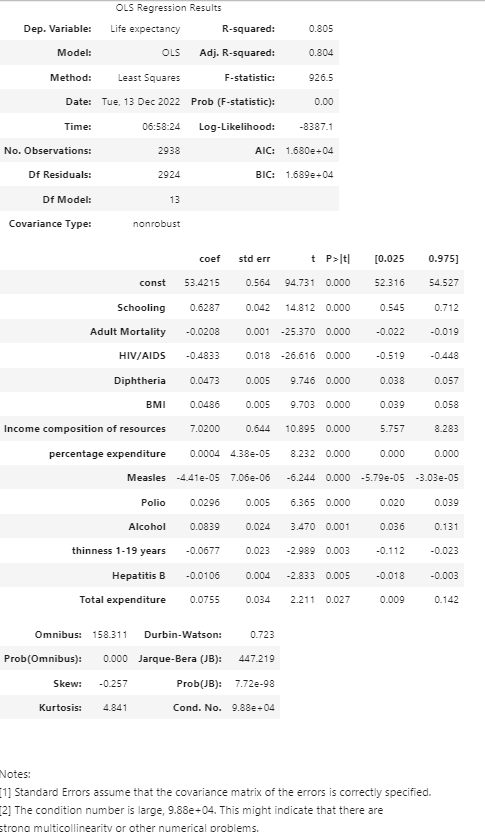
Compared with the results of backward stepwise regression and forward stepwise regression, we found that the goodness of fit (R²) of backward method is higher than that of forward one in our example.
Normally, forward and backward stepwise regression would give us the same result, but this is not always the case even we have the same features in the final model.
Online Course
If you are interested in learning Python data analysis in details, you are welcome to enroll one of my courses:
Master Python Data Analysis and Modelling Essentials