

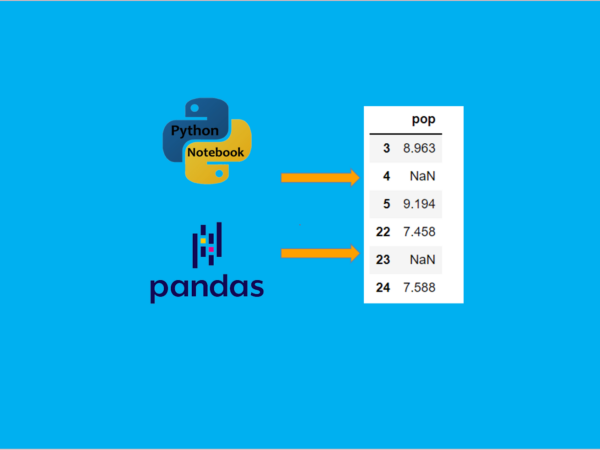
Pandas provides many convenient methods to impute missing values in the dataset
In this article, we learn how to deal with the missing values in a dataset using different methods, including drop, impute or fill, and interpolate the missing values of the Dataframe.
This article is the Part V of Data Analysis Series, which includes the following parts. I suggest you read from the first part so that you can better understand the whole process.
- Part I: How to Read Dataset from GitHub and Save it using Pandas
- Part II: Convenient Methods to Rename Columns of Dataset with Pandas in Python
- Part III: Different Methods to Access General Information of A Dataset with Python Pandas
- Part IV: Different Methods to Easily Detect Missing Values in Python
- Part V: Different Methods to Impute Missing Values of Datasets with Python Pandas
- Part VI: Different Methods to Quickly Detect Outliers of Datasets with Python Pandas
- Part VII: Different Methods to Treat Outliers of Datasets with Python Pandas
- Part VIII: Convenient Methods to Encode Categorical Variables in Python
I will use the renamed dataset gdp_china_renamed.csv, which was processed in the previous article, “Convenient Methods to Rename Columns of Dataset with Pandas in Python”. You are encouraged to use your own data with missing values.
# import required packages
import pandas as pd

# read data
df = pd.read_csv('./data/gdp_china_renamed.csv')

# display names of the columns
df.columns
1. Drop Missing Values
The first choice to be considered is to remove the missing values. The .drop method of Pandas can be used to delete the missing values.
(1) drop a row with all missing values
Suppose there is a row whose values are all missing, i.e. null values(NaN).
drop_row_all = df.dropna(how = 'all')missings = drop_row_all.isna().sum().sum()
print(f'Missings:{missings}')Missings:2
The missing values have been removed. Why? That is because that there is no row whose values are all missing in the dataset used.
(2) drop rows with at least one missing value
It means that the row will be removed if it contains one missing value or more missing values. As we know from the detection results, the dataset used have two rows, each of which contains one missing value, i.e. Nan value (or Null value). Thus, this method meets our need.
drop_one_more = df.dropna( )missings = drop_one_more.isna().sum().sum()
print(f'Missings:{missings}')Missing:0
The result above shows that there are no missing value because the rows with the missing values were removed. You use df.dropna(inplace=True), and then the original dataset will be changed. Because I will still use the original dataset for the following methods, so I use new variable name.
(3) drop a column which have with one or missing values
In some cases, maybe we need this method. But be careful of that this method will delete a whole column, i.e. a variable, from the dataset.
drop_col = df.dropna(axis = 1)drop_col.head()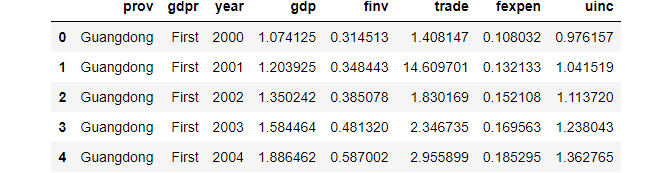
From the above result, we can that the pop column has been removed.
2. Fill Missing Values
In the last article, we have found that the missing values are at row indexes of [4, 23]. Let’s display these missing values with few values before and after them.
idx = [3,4,5,22,23,24]df.loc[idx,['pop']]
(1) fill missing values with specific guess values
Now, you can see that the missing values are not many, only 2 in this example. In this case, we can put specific guess values instead of the missing values.
For example, we use can any number from 8.963 to 9.194 for the first missing value, and a number from 7.458 to 7.588 for the second missing value.
However, there are advanced methods to impute these missing values. Let’s see some convenient methods as follows.
(2) fill missing values with the mean value(s)
fill_mean = df.fillna(df.mean())
There is a future warning for the above method, and it suggests selecting only the columns with missing values. In our case, it is the pop column. To avoid this warning and error in the future, we only deal with the `pop’ column.
fill_mean = df.fillna(df['pop'].mean())fill_mean.loc[idx,['pop']]
(3) fill missing values with ffill method
We can fill the missing values using the forward filling method, i.e. ffill(), in which the previous values of the missing values are used to fill the missing values.
df_ffill = df.fillna(method='ffill')df_ffill.loc[idx,['pop']]
(4) fill missing values with bfill method
We can fill the missing values using the backward filling method, i.e. bfill(), in which the values behind the missing values are used to fill the missing values.
df_bfill = df.fillna(method='bfill')df_bfill.loc[idx,['pop']]
For more information on filling missing values, please refer to the Pandas’ online office document.
3. Fill with Interpolation
Furthermore, Pandas provide more advanced built-in interpolation method. Let’s see some examples.
(1) linear method
The default method is linear interpolation.
df_interp =df.interpolate()df_interp.loc[idx,['pop']]
(2) polynomial method
df_poly =df.interpolate(method='polynomial',order=2)df_poly.loc[idx,['pop']]
(3) cubic spline method
df_cubspline =df.interpolate(method='cubicspline',order=2)df_cubspline.loc[idx,['pop']]
Refer to the online document of Pandas for more information on interpolation.
4. Save Data
Finally, let’s save the processed results with as cubicspline method as csv file in the working directory for future analysis use.
df_cubspline.to_csv('./data/gdp_china_mis_filled.csv',index=False)5. Online Course
If you are interested in learning Python data analysis in details, you are welcome to enroll one of my course:
Master Python Data Analysis and Modelling Essentials