


Convenient Pandas’ methods to access the information of dataset better before processing and analyze it
This article is the Part III of Data Analysis Series, which includes the following parts. I suggest you read from the first part so that you can better understand the whole process.
- Part I: How to Read Dataset from GitHub and Save it using Pandas
- Part II: Convenient Methods to Rename Columns of Dataset with Pandas in Python
- Part III: Different Methods to Access General Information of A Dataset with Python Pandas
- Part IV: Different Methods to Easily Detect Missing Values in Python
- Part V: Different Methods to Impute Missing Values of Datasets with Python Pandas
- Part VI: Different Methods to Quickly Detect Outliers of Datasets with Python Pandas
- Part VII: Different Methods to Treat Outliers of Datasets with Python Pandas
- Part VIII: Convenient Methods to Encode Categorical Variables in Python
In the Part I and II, we discussed How to Read Dataset from GitHub and Save it using Pandas and also talked about Convenient Methods to Rename Columns of Dataset with Pandas. In this article, we will see how to access basic information of a DataFrame dataset.
First, let’s import the required packages and read the dataset into Pandas’ DataFrame. We use gdp_china_renamed.csv, which is the dataset that we renamed the columns of the original dataset in GitHub and saved into the local working directory. If you are very familiar with methods to read a dataset into pandas and methods to rename the columns, you can use your own dataset. But I strongly suggest you to read the previous two articles so that you will better understand the methods and the whole process that I use.
# Load the required package
import pandas as pd

# Read the data
df = pd.read_csv('./data/gdp_china_renamed.csv')1. Access the First Few Rows
(1) Access the first 5 rows
df.head()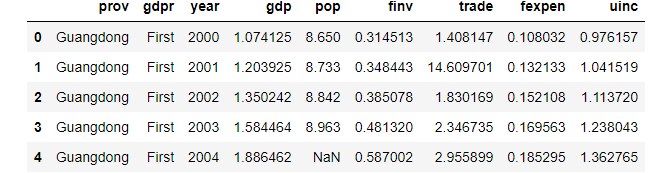
(2) Access the first N rows
To access the first N rows, just use df.head(N), for example, first 3 rows.
df.head(3)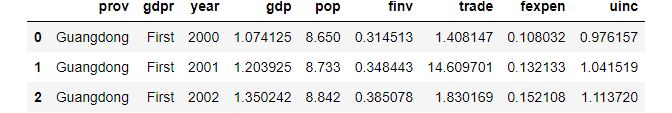
2. Access the Last Few Rows
(1) Access the last 5 rows
df.tail()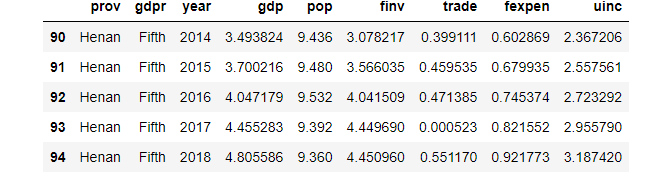
(2) Access the last N rows
For example, the last 2 rows
df.tail(2)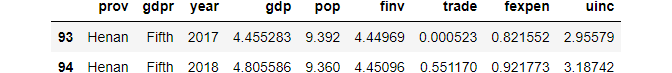
3. Randomly Accessing N Rows
For example, randomly get 5 rows, where the result is varied for each run.
df.sample(5)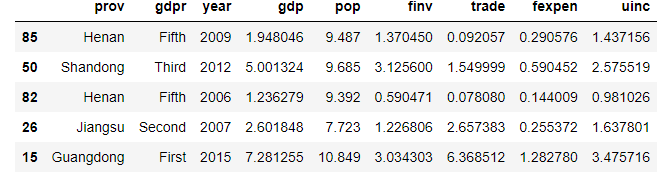
4. Access All but Few Rows
(1) Access all rows except last N rows
For example, skipping the last 2 rows.
df.head(-2)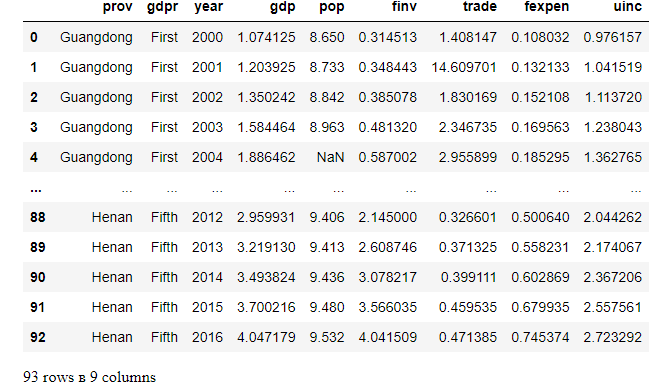
(2) Access all rows except the first N rows
For example, access all but the first 3 rows.
df.tail(-3)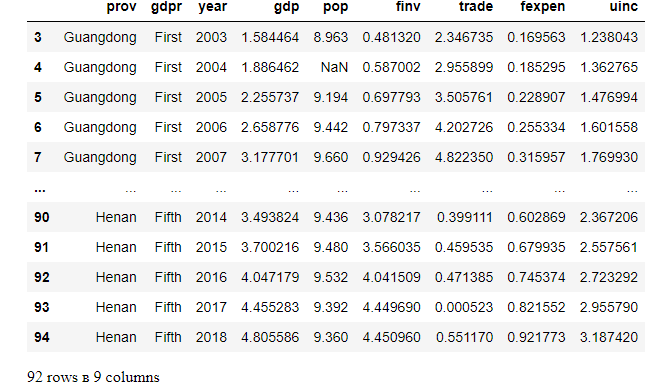
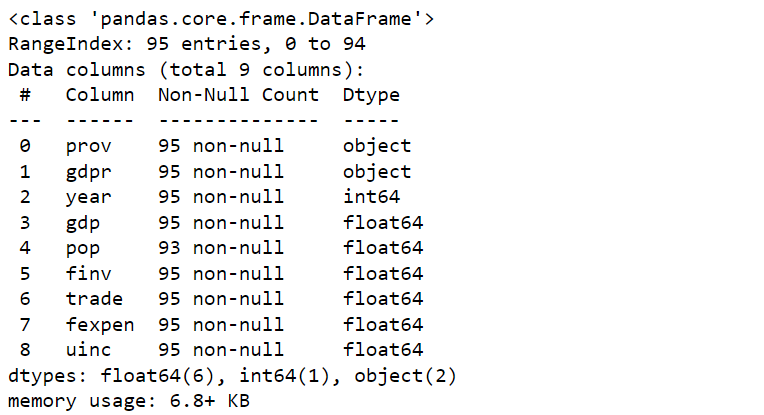
5. Obtain a General Data Information Summary
We use info() to get data information, which highlights the total number of rows, names of the columns, their data type, and any missing value.
df.info()The result looks as follows:
6. Check a Column’s Date Type
df['year'].dtypeThe output is:
dtype(‘int64’)
7. Check Column Names
df.columnsIt results in the following output:

8. Check Dataset Shape
df.shapeThe output is as follows:
(95, 9)
9. Generate a General Descriptive Statistics Summary
df.describe()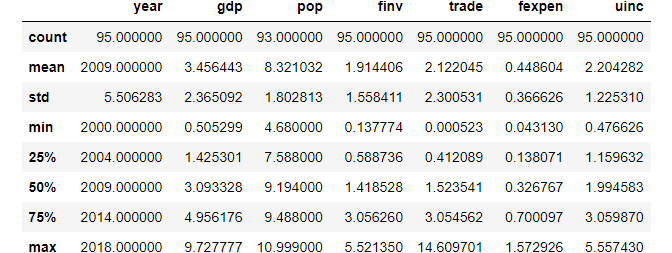
We can transform the table by adding .Tat the end.
df.describe().T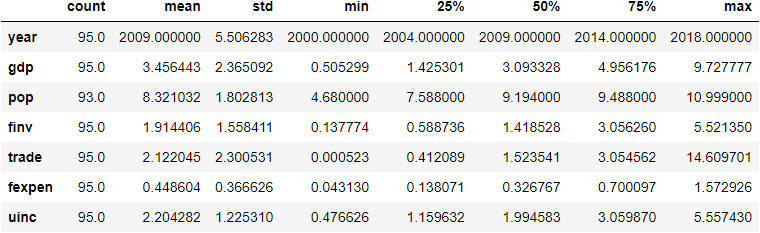
We can save this descriptive statistics summary into a .csv file in the working directory.
df.to_csv('./results/describe_result.csv')10. Online Course
If you are interested in learning Python data analysis in details, you are welcome to enroll one of my course:
Master Python Data Analysis and Modelling Essentials