


Use different methods to detect missing values in a dataset using Python Pandas library
This article is the Part IV of Data Analysis Series, which includes the following parts. I suggest you read from the first part so that you can better understand the whole process.
- Part I: How to Read Dataset from GitHub and Save it using Pandas
- Part II: Convenient Methods to Rename Columns of Dataset with Pandas in Python
- Part III: Different Methods to Access General Information of A Dataset with Python Pandas
- Part IV: Different Methods to Easily Detect Missing Values in Python
- Part V: Different Methods to Impute Missing Values of Datasets with Python Pandas
- Part VI: Different Methods to Quickly Detect Outliers of Datasets with Python Pandas
- Part VII: Different Methods to Treat Outliers of Datasets with Python Pandas
- Part VIII: Convenient Methods to Encode Categorical Variables in Python
In this article, I will display different methods to easily detect the missing values in your datasets using Pandas in Python. In the previous articles, we talked about How to Read Dataset from GitHub and Save it using Pandas and Convenient Methods to Rename Columns of Dataset with Pandas. I suggest you reading these two articles first because we will use the precessed dataset in the articles. If you are familiar with these, and you also have your own dataset to use, you can skip these two articles. This article will follow the following working process:
- Generally check if there is any missing value, if so
- Calculate the frequency of missing (or how many)
- Find the locations of the missing values are (i.e. their indices)
1. Preparation to Start
(1) import required packages
import numpy as np
import pandas as pd
import matplotlib.pyplot as plt
import seaborn as sns
(2) read the dataset
In the last post, we have renamed the columns of the dataset to the abbreviations of their original names and saved the renamed dataset gdp_china_renamed.csv into the local working directory. Let’s import the dataset now.
df = pd.read_csv('./data/gdp_china_renamed.csv')

# display columns
df.columns

2. Different Methods to Detect Missing Values
First, we just check generally whether there are any missing using some handy methods.
2.1 Roughly check if there are any missing
There are different methods to check generally whether there are any missing using some handy methods. In this article, three practical methods will be introduced as follows.
(1) Using info( ) function
df.info()The result looks as follows:

The above results show that pop might have 2 missing values since it has only 93 values in the dataset while other variables have 95 values. I say “might” because the total number of each variable are calculated based on non-null values. That is to say, the values might be zeros rather than missing in many cases. For this case and dataset, however, population (pop) cannot be zero, so we can conclude that pop has two missing values.
(2) Using simple line plot
We can also use a simple line plot to see if there are any missing. Whereas, the limitation of this method is not suitable for large and noisy data.
cols = ['year', 'gdp', 'pop', 'finv', 'trade', 'fexpen','uinc']
plt.figure(figsize=(15,15))

for i, each in enumerate(cols):
    plt.subplot(len(cols),2,i+1)
    plt.plot(df[each])
    plt.title(each)
    plt.tight_layout()
plt.show()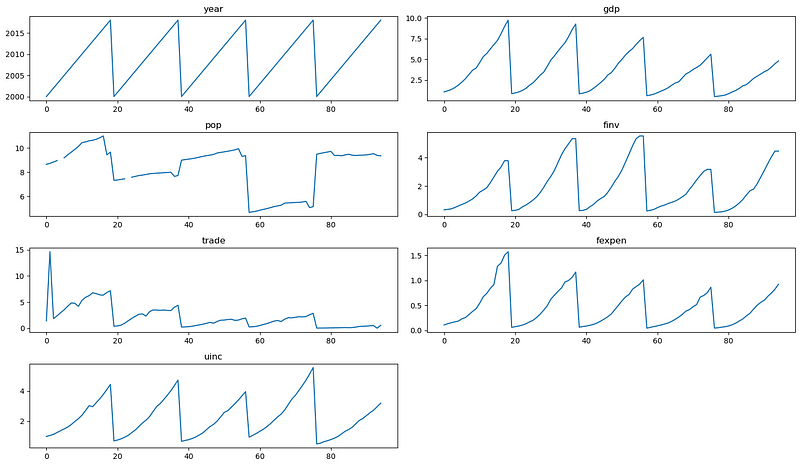
The plot results clearly display that pop has missing values.
(3) isna() method
The third method here is to use Pandas’ isna().any() to detect which variables have missings.
df.isna().any()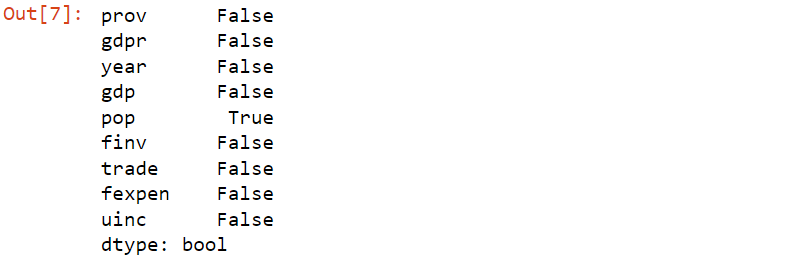
(4) Using heatmap
Besides, the null-value heatmap with seaborn can be used to clearly illustrate if there is any missing in a dataset.
sns.heatmap(df.isna(),cbar=False) 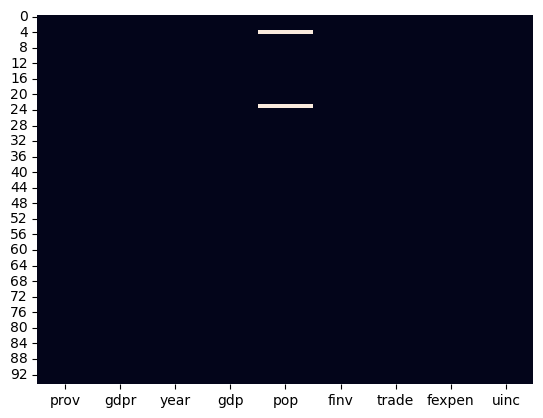
From the heatmap, we also can see there are 2 missings in the population data.
2.2 The frequency of Missings (absolute)
Next, let’s see how to calculate the number and frequency of missings though some methods above can also roughly show how many missings in the data.
(1) use isna().sum().sum()
missings = df.isna().sum().sum()

print(f'The number of missing values: {missings}')
The result is:
The number of missing values: 2
(2) use isna().sum()/(len(data))
df.isna().sum()/(len(df))*100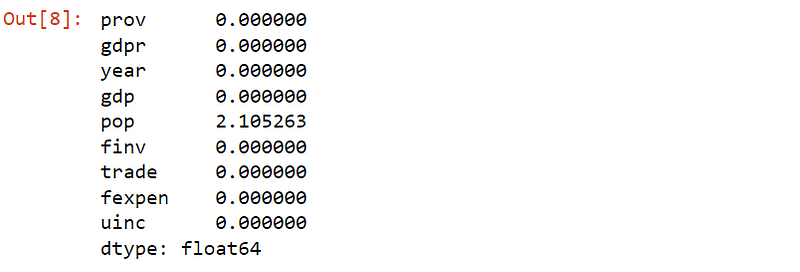
We can print a readable result on the columns with lowest and highest amounts of missing frequencies in the following way.
mis_freq = df.isna().sum()/len(df)*100

print("Column with the lowest amount of missings contains {} % missings.".format(mis_freq.min()))
print("Column with the highest amount of missings contains {} % missings.".format(mis_freq.max()))
2.3 Determine positions of missings
Let’s further detect where the missing are, i.e. their indices.
(1) Determine the columns of the missings.
m_col = df.loc[:, df.isnull().any()].columns

print(f'The columns with missings is/are {m_col[0]}.')
The columns with missings is/are pop.
(2) Determine row index of the missings
There are different ways to find the indices of the missings .
(I) use Pandas index
df[df['pop'].isna()].indexInt64Index([4, 23], dtype=’int64′)
(II) use NumPy where
np.where(df['pop'].isna())(array([ 4, 23], dtype=int64),)
(III) use Pandas DataFrame table
df[df['pop'].isna()]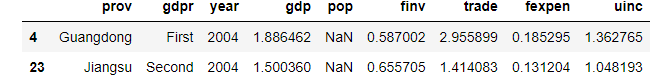
All the results from the above methods show that the row indices of 4 and 23 contain missing values. Finally, we found that the population column has 2 missing values with the row index of 4 and 23, respectively. Then you can replace the missings in the next step, which I will probably discuss in the future.
3. Online course
If you are interested in learning Python data analysis in details, you are welcome to enroll one of my courses:
Master Python Data Analysis and Modelling Essentials