Reshape DataFrame with pandas is to transform the structure of the DataFrame to better suit the analysis or visualization needs
Reshape DataFrame with pandas is a common task when working with data analysis and manipulation. It involves transforming the structure of the DataFrame to better suit the analysis or visualization needs. Fortunately, pandas provides several methods that allow us to reshape the data effortlessly. In this tutorial, we will explore different techniques to reshape a pandas DataFrame using functions like transpose() or T, pivot(), melt(), stack(), unstack(), and combining groupby() and agg().
Methods for Reshaping a Pandas DataFrame:
‘transpose()’ or T: This function interchanges the rows and columns of a DataFrame, effectively reshaping it.
‘pivot()’: This function converts unique values from one column into multiple columns, resulting in a wider DataFrame. It allows us to create a new column for each unique value, making it useful for summarizing and comparing data across categories.
‘melt()’: The melt() function is used to transform a DataFrame from wide format to long format. It gathers columns into rows, creating a “variable” column and a “value” column. This method is handy when we need to stack or unpivot multiple columns.
‘stack()’ and ‘unstack()’: These functions are used when dealing with multi-level column indexes. stack() pivots a level of column labels to the innermost level of row labels, creating a more compact DataFrame. On the other hand, unstack() performs the reverse operation, converting the innermost row labels to column labels.
Combining groupby() and agg(): This approach is powerful for reshaping a DataFrame based on groups. By grouping the DataFrame using specific columns and applying aggregation functions through agg(), we can summarize the data and reshape it into a new structure.
1. ‘transpose()’ method
The transpose() method in pandas is used to interchange the rows and columns of a DataFrame, effectively reshaping it. This method allows you to rotate the DataFrame, making the columns become rows and vice versa. Here’s an example:import pandas as pd
# Create a sample DataFrame
data = {
'City': ['New York', 'London', 'Tokyo'],
'Temperature': [30, 25, 35],
'Precipitation': [100, 80, 120]
}
df = pd.DataFrame(data)
df
# Transpose the DataFrame
transposed_df = df.transpose()
transposed_df
You can use the shortform of df.T to get the same result.
transposed_df = df.T
transposed_df
In the above example, the original DataFrame has three columns: ‘City’, ‘Temperature’, and ‘Precipitation’. After applying the transpose() method, the columns become rows, resulting in a new DataFrame where the original column names are now the row index. Each row represents a column from the original DataFrame.
Transposing a DataFrame can be useful when you want to switch the orientation of your data or when you need to perform specific operations on rows instead of columns. However, it’s important to note that transposing a large DataFrame can significantly impact memory usage, so use it judiciously.
Remember that the transpose() method returns a new DataFrame, and if you want to modify the original DataFrame in-place, you can assign the transposed DataFrame back to the original variable:
Keep in mind that when you transpose a DataFrame, the original index values become column headers, and the original column headers become the new index.
2. ‘pivot()’ method
The pivot() function allows you to reshape a DataFrame by converting unique values from one column into multiple columns. Here’s an example:import pandas as pd
# Create a sample DataFrame
data = {
'City': ['New York', 'London', 'Tokyo', 'Paris'],
'Year': [2019, 2019, 2020, 2020],
'Temperature': [30, 25, 35, 28]
}
df = pd.DataFrame(data)
df
# Reshape the DataFrame using pivot()
reshaped_df = df.pivot(index=’Year’, columns=’City’, values=’Temperature’)
reshaped_df
3. ‘melt()’ method
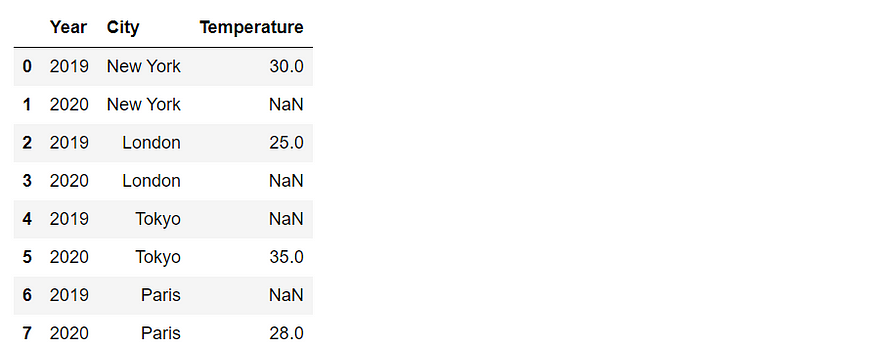
The melt() function is used to unpivot a DataFrame from wide format to long format. It gathers columns into rows, creating a “variable” column and a “value” column. Here’s an example:import pandas as pd
# Create a sample DataFrame
data = {
'Year': [2019, 2020],
'New York': [30, None],
'London': [25, None],
'Tokyo': [None, 35],
'Paris': [None, 28]
}
df = pd.DataFrame(data)
df
# Reshape the DataFrame using melt()
reshaped_df = df.melt(id_vars=’Year’, var_name=’City’, value_name=’Temperature’)
reshaped_df
4. ‘stack()’ and ‘unstack()’ method
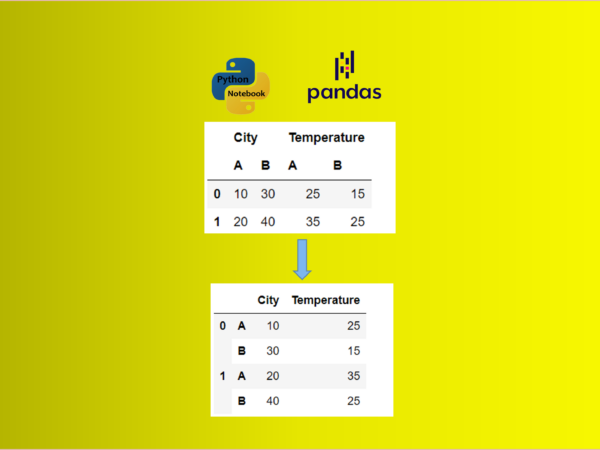
The stack() function is used to pivot a level of column labels to the innermost level of row labels, while unstack() does the opposite. These functions are helpful when dealing with multi-level column indexes. Here’s an example:
import pandas as pd

# Create a sample DataFrame with multi-level column index
data = {
('City', 'A'): [10, 20],
('City', 'B'): [30, 40],
('Temperature', 'A'): [25, 35],
('Temperature', 'B'): [15, 25]
}
df = pd.DataFrame(data)
df
# Reshape the DataFrame using stack()
stacked_df = df.stack()
stacked_df
# Reshape the DataFrame using unstack()
unstacked_df = stacked_df.unstack()
unstacked_df
5. Combining ‘groupby()’ and ‘agg()’
This combination functions can be a powerful way to reshape a pandas DataFrame. Here’s an example:import pandas as pd
# Create a sample DataFrame
data = {
'City': ['New York', 'London', 'Tokyo', 'Paris', 'New York', 'London', 'Tokyo', 'Paris'],
'Year': [2019, 2019, 2019, 2019, 2020, 2020, 2020, 2020],
'Temperature': [30, 25, 35, 28, 32, 27, 38, 30],
'Precipitation': [100, 80, 120, 90, 110, 70, 130, 100]
}
df = pd.DataFrame(data)
df
# Reshape the DataFrame using groupby() and agg()
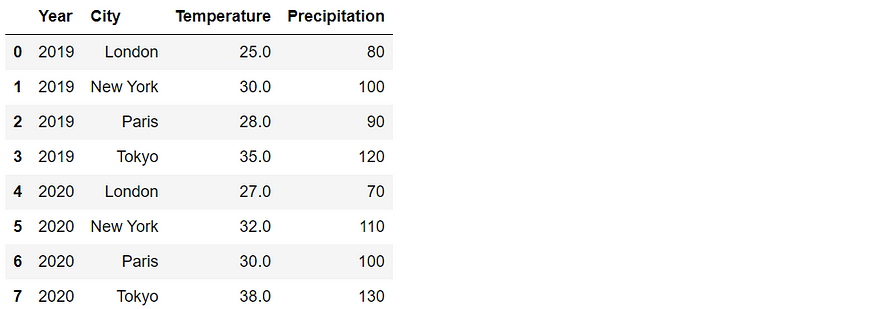
reshaped_df = df.groupby(['Year', 'City']).agg({'Temperature': 'mean', 'Precipitation': 'sum'}).reset_index()
reshaped_df
# Reshape the DataFrame using groupby() and agg() by year
reshaped_df = df.groupby(['Year']).agg({'Temperature': 'mean', 'Precipitation': 'sum'}).reset_index()
reshaped_df
# Reshape the DataFrame using groupby() and agg() by City
reshaped_df = df.groupby(['City']).agg({'Temperature': 'mean', 'Precipitation': 'sum'}).reset_index()
reshaped_df
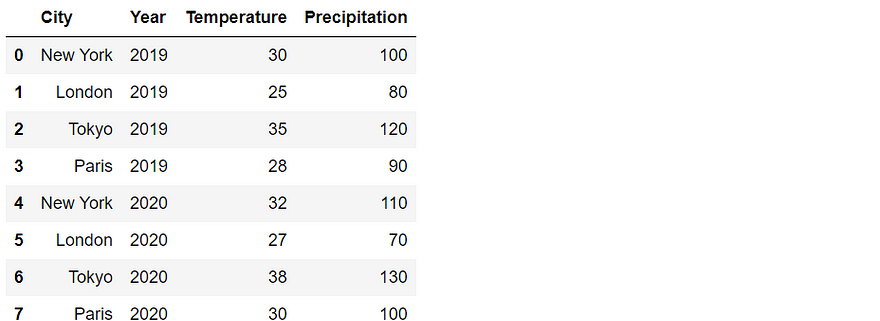
In this example, we grouped the DataFrame by the ‘Year’ and ‘City’ columns and applied aggregation functions to reshape the data. We calculated the mean of the ‘Temperature’ column and the sum of the ‘Precipitation’ column for each group. The resulting DataFrame has a row for each unique combination of ‘Year’ and ‘City’ with the aggregated values.
You can customize the aggregation functions and columns according to your specific requirements.
Conclusion
Reshaping a pandas DataFrame is an essential skill for data analysts and scientists. Understanding different methods such as ‘transpose()’ or T, pivot(), melt(), stack(), unstack(), and combining groupby() and agg() allows you to manipulate and transform your data into the desired format. By leveraging these techniques, you can effectively reshape your DataFrame to meet specific analysis, visualization, or modeling requirements. Experiment with these methods, adapt them to your use cases, and unleash the full potential of pandas for data reshaping.
Originally published at https://medium.com/ on June 25, 2023.


