

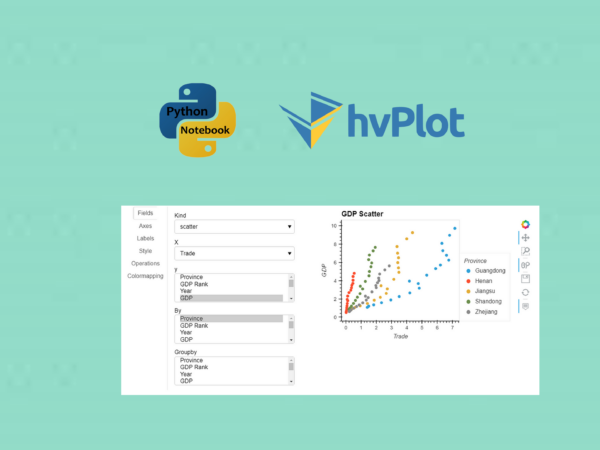
To display 5 easy methods to generate interactive plot widgets and GUI for data visualization using hvPlot
In the previous three parts of hvPlot, it has demonstrated how to change the plotting backends, how to create the most widely used basic plots and the multiple plots including subplots, overlay and layout plots. This article will continue to display how to generate interactive plot widgets and GUI using hvPlot.
This article uses a social economic dataset of Chinese top 5 economic provinces, because this dataset presents a very typical data arrange formation, and it has been used in some of my previous articles. Besides, it is also very easy to understand, which includes the following variables:
- prov: Province
- gdpr: GDP ranking
- year: Year
- gdp: GDP (x1⁰⁸CNY)
- pop: Total population (x10⁴ person)
- finv: Fixed asset investment (x10⁸ CNY)
- trade: Total imports and exports (CNY)
- fexpen: Fiscal expenditure (x10⁹CNY)
- uinc: Urban disposal income per capita (CNY)
However, it does not need to understand these variables. You can just regard them as x1, x2, x3, …, if you are not familiar with these terms.
This dataset can directly read from one of my GitHub repository directory. If you are interested in reading the dataset from your local computer, you just download it and put it into your current working directory (CWD). Or you read it with pandas and then save it into your CWD. You can read this article if you are not familiar with this process.