

It is helpful to plot a horizontal or vertical line to divide a plot into different parts
Matplotlib is a powerful Python library for creating visualizations, including line plots. Drawing horizontal and vertical lines on a plot is a common task when analyzing data or highlighting specific values or regions of interest. In this tutorial, we will explore three different methods to achieve this using Matplotlib: the ‘axhline’ and ‘axvline’ functions, the ‘plot’ function, and the ‘hlines’ and ‘vlines’ functions.
By the end of this tutorial, you will have a clear understanding of how to plot horizontal and vertical lines using Matplotlib, enabling you to enhance your data visualizations and convey important insights effectively.
Method 1: Using the ‘axhline’ and ‘axvline’ Functions
The ‘axhline’ and ‘axvline’ functions are the simplest methods to draw horizontal and vertical lines, respectively. Here’s an example:import matplotlib.pyplot as plt
# Create a figure and axis
fig, ax = plt.subplots()

# Plotting horizontal line
ax.axhline(y=0.5, color='r', linestyle='--', linewidth=2)

# Plotting vertical line
ax.axvline(x=0.7, color='b', linestyle=':', linewidth=2)

# Display the plot
plt.show()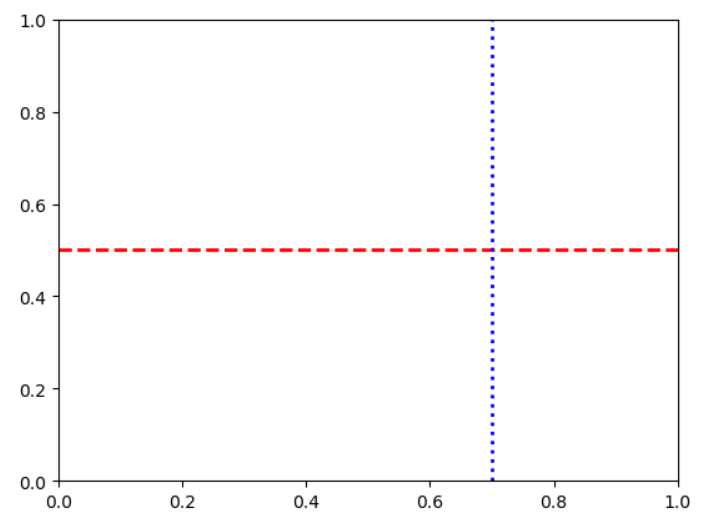
In this example, we create a figure and an axis using ‘plt.subplots()’. Then, we use the ‘axhline’ function to draw a horizontal line at ‘y=0.5’, specifying the color, linestyle, and linewidth. Similarly, we use the ‘axvline’ function to draw a vertical line at ‘x=0.7’. Finally, we call ‘plt.show()’ to display the plot.
Method 2: Using the ‘plot’ Function
The ‘plot’ function can also be used to draw horizontal and vertical lines. Here’s an example:
import matplotlib.pyplot as plt
import numpy as np

# Create x-axis values
x = np.linspace(0, 1, 100)

# Create y-axis values for horizontal line
y_hline = np.full_like(x, 0.5)

# Create y-axis values for vertical line
y_vline = np.linspace(0, 1, 100)

# Create a figure and axis
fig, ax = plt.subplots()

# Plotting horizontal line
ax.plot(x, y_hline, color='r', linestyle='--', linewidth=2)

# Plotting vertical line
ax.plot([0.7, 0.7], [0, 1], color='b', linestyle=':', linewidth=2)

# Display the plot
plt.show()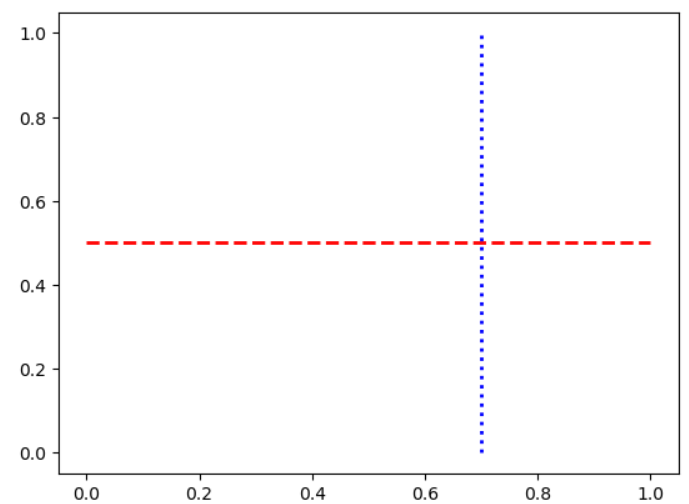
In this example, we create an array x using ‘np.linspace’ to generate evenly spaced values between 0 and 1. Then, we create a corresponding array ‘y_hline’ filled with ‘0.5’ values for the horizontal line. For the vertical line, we use the same x array for the ‘x-axis’ values, and manually specify the y-axis values as ‘[0, 1]’.
Next, we create a figure and an axis using ‘plt.subplots()’. We use the plot function to draw the horizontal line by plotting ‘x’ against ‘y_hline’ and specifying the color, linestyle, and linewidth. Similarly, we use the plot function to draw the vertical line by plotting ‘[0.7, 0.7]’ against ‘[0, 1]’. Finally, we call ‘plt.show()’ to display the plot.
Method 3: Using the ‘hlines’ and ‘vlines’ Functions
The ‘hlines’ and ‘vlines’ functions can be used to draw horizontal and vertical lines across the entire plot, respectively. Here’s an example:
import matplotlib.pyplot as plt

# Create a figure and axis
fig, ax = plt.subplots()

# Plotting horizontal line
ax.hlines(0.5, 0, 1, colors='r', linestyles='--', linewidths=2)

# Plotting vertical line
ax.vlines(0.7, 0, 1, colors='b', linestyles=':', linewidths=2)

# Display the plot
plt.show()
In this example, we create a figure and an axis using ‘plt.subplots()’. Then, we use the ‘hlines’ function to draw a horizontal line at y=0.5, specifying the start and end x-coordinates, colors, linestyles, and linewidths. Similarly, we use the ‘vlines’ function to draw a vertical line at ‘x=0.7’, specifying the start and end y-coordinates, colors, linestyles, and linewidths. Finally, we call ‘plt.show()’ to display the plot.
These are three different methods you can use to draw horizontal and vertical lines using Matplotlib. Feel free to choose the one that suits your needs best.
Conclusion
In this tutorial, we have covered three different methods to plot horizontal and vertical lines using Matplotlib. The ‘axhline’ and ‘axvline’ functions provide a straightforward way to draw lines at specific positions, while the ‘plot’ function allows for more flexibility by plotting arrays of x and y values. The ‘hlines’ and ‘vlines’ functions are useful when you want to draw lines across the entire plot. By mastering these techniques, you can create visually appealing and informative plots that effectively highlight important information or patterns in your data. Remember to experiment with different colors, linestyles, and linewidths to customize the appearance of your lines. Matplotlib’s versatility and ease of use make it a valuable tool for data visualization and exploration.
Originally published at https://medium.com/ on June 24, 2023.