

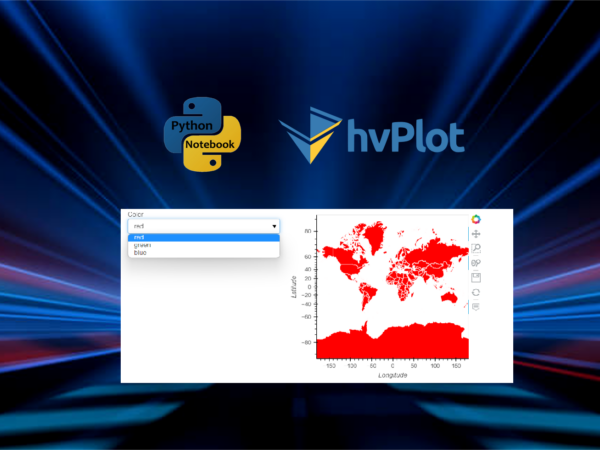
To demonstrate how to use hvPlot syntax to easily create interactive maps
hvPlot is a Python library that provides an easy-to-use interface for creating interactive visualizations of data. In the previous four articles, we have demonstrated how to create interactive plots with hvPlot. When it comes to geospatial data, hvPlot offers a geospatial plotting interface that allows you to create interactive maps and spatial visualizations using a variety of geographic projections.
For geospatial data or just called geodata, we have displayed how to use GeoPandas for geodata visualization in this previous article. In this tutorial, we will learn how to use hvPlot to create interactive maps from geospatial datasets. We will cover the basics of creating a simple map, adding interactivity, customizing with widgets, adding layers and overlays, and some advanced features.