

Convenient methods to quickly detect outliers in dataset with Pandas
This article is the Part VI of Data Analysis Series, which includes the following parts. I suggest you read from the first part so that you can better understand the whole process.
- Part I: How to Read Dataset from GitHub and Save it using Pandas
- Part II: Convenient Methods to Rename Columns of Dataset with Pandas in Python
- Part III: Different Methods to Access General Information of A Dataset with Python Pandas
- Part IV: Different Methods to Easily Detect Missing Values in Python
- Part V: Different Methods to Impute Missing Values of Datasets with Python Pandas
- Part VI: Different Methods to Quickly Detect Outliers of Datasets with Python Pandas
- Part VII: Different Methods to Treat Outliers of Datasets with Python Pandas
- Part VIII: Convenient Methods to Encode Categorical Variables in Python
Outliers detection plays a very important role is data analysis and modelling. In this article, we will learn how to detect outliers in a dataset with some handy methods.
1. What are Outliers?
Outliers are data points which are very far or significantly different from all other data points. There are two types of outliers in general, namely Natural outliers and Non-natural outliers.
The non-natural outliers are those which are caused by measurement errors, wrong data collection, or wrong data entry, while natural outliers could be the use case of fraudulent transactions in banking data, etc. In this sense, it is not correct to say that outliers are the wrong data.
2. Preparation to Start
(1) Import required packages
import pandas as pd
from matplotlib import pyplot as plt
import seaborn as sns
(2) Read the data
We use the dataset that we have stored after imputing the missing values of the original dataset.
# read the dataset
df = pd.read_csv('./data/gdp_china_mis_filled.csv')

# display the column names
df.columns
3. Outliers Detection Methods
There are various different methods to detect the outliers in a dataset. In this article, we just see some easily used ones.
(1) Descriptive statistic method
We can use Pandas’s Generally judge if there are outliers in general.
df.describe()
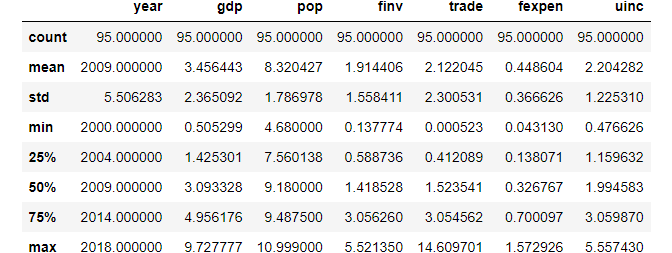
You can analyze this table of descriptive statistics summary column by column. But here let’s only analyze the trade column together. When we see the trade column, it is not hard to find that its minimum value is very small and the maximum value is very large, which are far from the mean value. Specially, the minimum is much less than 25% value and maximum is much larger 75% value, indicating that trade column has outliers. When you see other columns, they seem normal.
(2) Plot methods
There are different plot types, which can used to detect the outliers, such as line plot, bar plot, box plot, scatter plot, etc. Here, I display how to detect outliers using box plot and scatter plot.
(I) Box plot
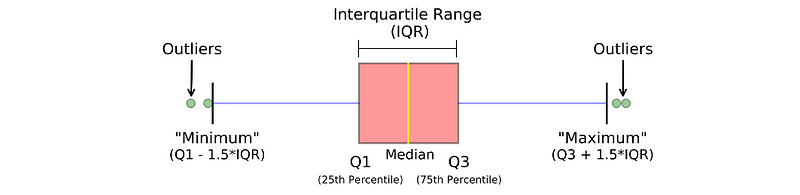
Box plot is a visualized way to some main descriptive statistics, which can express by the following simple figure.
Let’s make a scatter plot to see how our dataset looks like. You can use any visualization library to create a box plot, but I display how to use Pandas to easily make box plots.
boxplot = df.boxplot(figsize=(12,5),column=['gdp', 'pop', 'finv', 'trade', 'fexpen','uinc'])
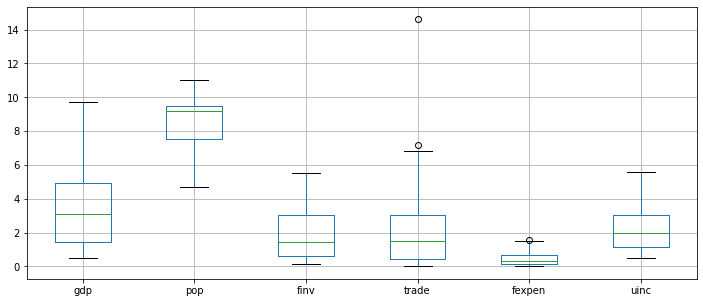
From the above plot result, we can see that trade has at least one outlier. However, this dataset involves 5 different provinces, each of which has quite different growth level. Thus, it is better to make box plots for each province.
boxplot = df.boxplot(figsize=(12,5),column=['gdp', 'pop', 'finv', 'trade', 'fexpen','uinc'],by='prov')
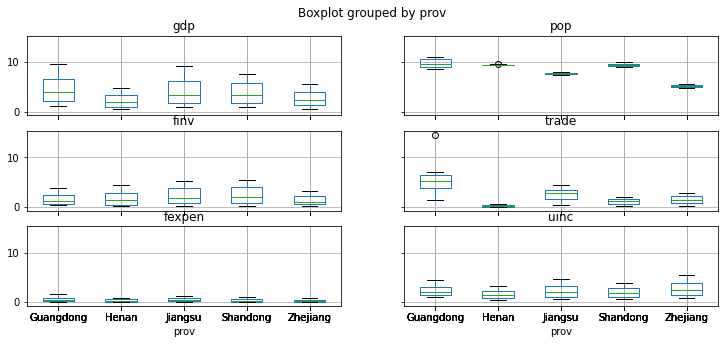
The box plot of the 5 provinces clearly illustrate that trade of Guangdong province has outliers.
(II) Matrix scatter plot
Python Seaborn library has very easy and convenient methods to make scatter plots and matrix scatter plots. In seaborn, the hue parameter denotes which column decides the kind of color. hue="prov" tells seaborn we want to colour the data points for 5 provinces differently.
sns.pairplot(data=df,hue='prov')
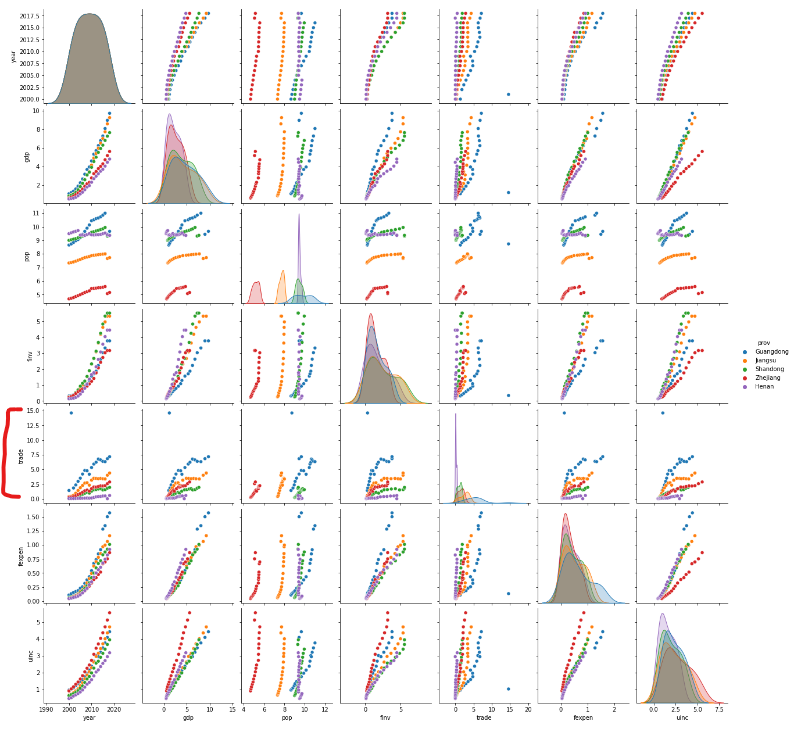
We can check the above matrix row by row, or column by column. Let’s analyze it by rows from the top to the bottom. It is quickly to find that trade row has outliers.
Let’s plot a large scatter plot for gdp vs trade in order to exam it in details.
plt.figure(figsize=(15,7))
sns.scatterplot(x='trade',y='gdp',data=df,hue='prov')
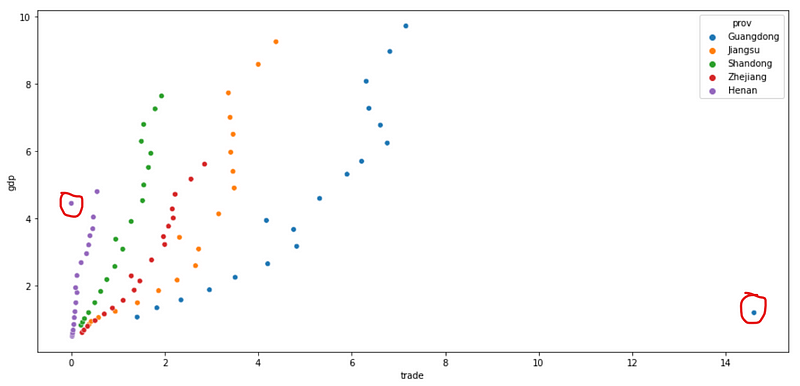
Now, we can find that there are two outliers in the dataset, where one smaller value is in the trade data of Henan province and another is very large in the trade data of Guangdong province,
(III) Find the location of the outliers
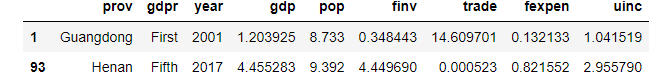
Let’s display their location, i.e. their row index.
df['trade'].idxmax(),df['trade'].idxmin()
(1, 93)
We display them in a Dataframe to see them clearly.
df.loc[[1,93]]
(IV) Quantile range method
This is a widely used method, thus let’s use this method to detect the outliers too.
min_threshold,max_threshold = df['trade'].quantile([0.01,0.99])
min_threshold,max_threshold
(0.017796237800000003, 7.607179460000017)
To display the outliers in a Pandas’ Dataframe too.
df[(df['trade']<min_threshold)|(df['trade']>max_threshold)]
4. Online Course
If you are interested in learning Python data analysis in details, you are welcome to enroll one of my course:
Master Python Data Analysis and Modelling Essentials