

Real-world data and concrete examples to display the methods to calculate aggregate statistics
This article will display how to easily calculate aggregate statistics of DataFrame with a real-world dataset using Python Pandas.
First, I would like to explain briefly, “What is summary statistics?” and “What is aggregation statistics?”
1. Summary statistics vs. Aggregation statistics
- Summary statistics: provide a quick and simple description of the data, including measures of data location, or central tendency of the data, such as mean, median, mode, minimum value, maximum value, range, standard deviation, etc.
- Data aggregation: the process where raw data is sliced, grouped, ordered into subsets and expressed in a summary form in order to further analyze.
- Aggregation statistics: the process of compute summary statistics of the aggregated data.
Since a DateFrame usually contains more than one column, and we usually slice, order, or group the dataset into subsets for statistical analysis, the calculations of summary statistics actually refer to aggregation statistics.
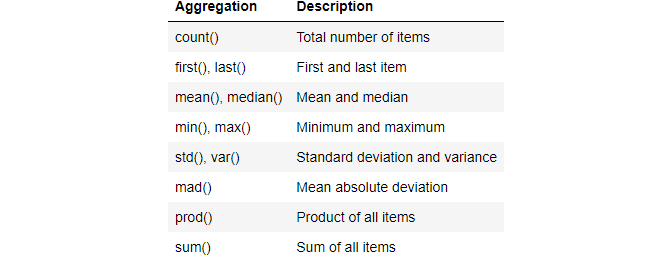
2. Built-in Pandas aggregations
The built-in aggregations in Python Pandas are summarized in the following table.
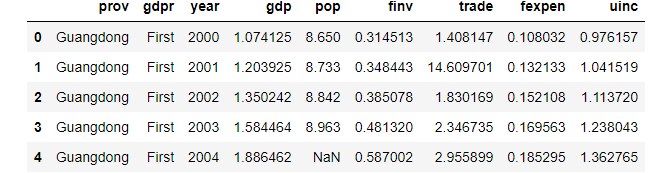
3. read the data
We will continue using the same dataset in the last few articles, please read how to download the dataset in one last article.
# Load the required packages
import pandas as pd
# Read the data
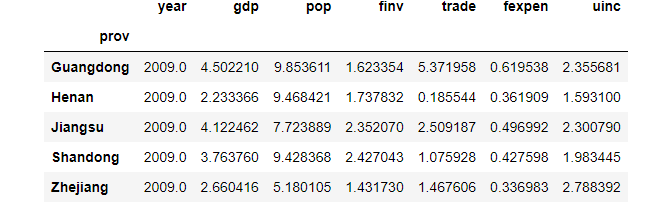
df = pd.read_csv('./data/gdp_china_renamed.csv')
# diplay the first 5 rows
df.head()
2. Aggregating statistics
(1) One column
For example, let’s calculate the mean of pop column.
df['pop'].mean()
8.321032258064516
(2) Multiple columns
Let’s take gdp and pop columns to take their median for instance.
df[['gdp','pop']].median()
gdp 3.093328
pop 9.194000
dtype: float64
3. Describe() method
(1) Whole DataFrame
We have already discussed this method in the previous article, Different Methods to Access General Information of Dataset with Python Pandas.
df.describe()

(2) Multiple columns
Actually, we can also use it for one or more columns, for example, for gdp and pop two columns.
df[['gdp','pop']].describe()

4. agg() method
Pandas’s agg() function provide specific combinations of aggregating statistics for given columns.agg is an alias for aggregate, and they have no difference, but agg is simple.
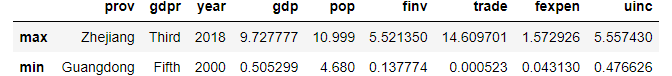
(1) Aggregate statistic functions over all the rows
For example, calculate max and min of all rows as follows/
df.agg(['max', 'min'])
(2) Aggregate over the columns.
When it is applied for columns, it needs to drop the string column(s), or it causes a future warning.
df.agg("mean", axis="columns")
Thus, we have to remove the string columns first.
df_new = df.drop(['prov','gdpr'],axis=1)
df_new.agg("mean", axis="columns")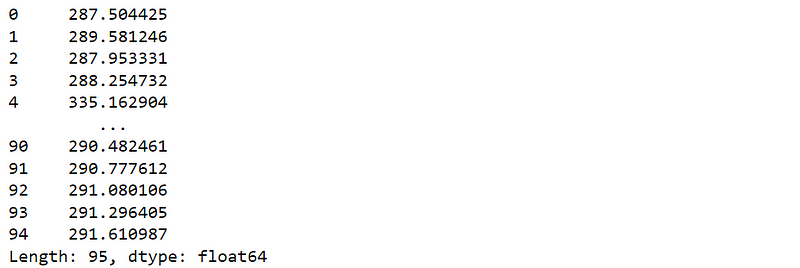
(3) Different aggregations per column
We can also calculate different aggregations for the selected columns.
df.agg(
    {
'gdp':['min','max','median','skew'],
'pop':['min','max','median','mean']

    }
)

(4) Different aggregations over the columns with renamed results
Let’s see how to calculate different aggregations over the columns and also change the names of results.
df.agg(x=('gdp', max), y=('pop', 'min'), z=('trade', 'mean'))
5. Aggregating statistics grouped by category
(1) Average GDP for each of the 5 provinces
df.groupby(['prov'])[['gdp']].mean()

(2) Average of each column for each of the 5 provinces
df.groupby(['prov']).mean()
6. Count total numbers of column items by category
df.groupby(['prov'])[['gdp']].count()

7. Online Course
If you are interested in learning Python data analysis in details, you are welcome to enroll one of my course:
Master Python Data Analysis and Modelling Essentials