


Filter bank method is an efficient way to implement Discrete Wavelet Transform
In the previous post, visualization of wavelet function and scaling function were illustrated. In this post, we will see how to visualize the filter banks of Discrete wavelet transform (WDT).
1. Wavelet Filter Bank
In practice, an efficient way to implement Discrete Wavelet Transform (DWT) is to use filters method, which was developed in 1988 by Mallat. This very practical filtering algorithm yields a Fast Discrete Wavelet Transform (FWT).
2. Wavelet filters coefficients
Wavelet filters coefficients are the most important information used in Discrete Wavelet Transforms (DWT). In the PyWavelets library of Python, filters coefficients can be obtained via the dec_lo, dec_hi, rec_lo and rec_hi attributes, which correspond to lowpass and highpass decomposition filters and lowpass and highpass reconstruction filters respectively.
In a previous article, we have already learned what PyWavelets is, how to install it, and how to display its built-in Wavelets families and their members in PyWavelets, and so on. In the PyWavelets, the filter_bankmethod returns a list for the current wavelet in the following order: [dec_lo, dec_hi, rec_lo, rec_hi].
dec_lo: Decomposition low-pass filterdec_hi: Decomposition high-pass filterrec_lo: Reconstruction low-pass filterrec_hi: Reconstruction high-pass filter
3. Print Filter Bank of a Discrete Wavelet
First, let’s import the required packages: one is PyWavelets and another is Matplotlib for visualization.
# import required packages
import pywt
import matplotlib.pyplot as plt
Next, we define a discrete wavelet, for example, “db5” , and then display its filter bank as follows:
wavelet = pywt.Wavelet('db5')wavelet.filter_bank
The output is as follows:
([0.0033357252854737712,
  -0.012580751999081999,
  -0.006241490212798274,
  0.07757149384004572,
  -0.032244869584638375,
  -0.24229488706638203,
  0.13842814590132074,
  0.7243085284377729,
  0.6038292697971896,
  0.16010239797419293],
 [-0.16010239797419293,
  0.6038292697971896,
  -0.7243085284377729,
  0.13842814590132074,
  0.24229488706638203,
  -0.032244869584638375,
  -0.07757149384004572,
  -0.006241490212798274,
  0.012580751999081999,
  0.0033357252854737712],
 [0.16010239797419293,
  0.6038292697971896,
  0.7243085284377729,
  0.13842814590132074,
  -0.24229488706638203,
  -0.032244869584638375,
  0.07757149384004572,
  -0.006241490212798274,
  -0.012580751999081999,
  0.0033357252854737712],
 [0.0033357252854737712,
  0.012580751999081999,
  -0.006241490212798274,
  -0.07757149384004572,
  -0.032244869584638375,
  0.24229488706638203,
  0.13842814590132074,
  -0.7243085284377729,
  0.6038292697971896,
  -0.16010239797419293])
We can just print one filter, for example, the decomposition low-pass filter using the following code:
wavelet.dec_lo
We get the following results:
[0.0033357252854737712,
 -0.012580751999081999,
 -0.006241490212798274,
 0.07757149384004572,
 -0.032244869584638375,
 -0.24229488706638203,
 0.13842814590132074,
 0.7243085284377729,
 0.6038292697971896,
 0.16010239797419293]
5. Visualization of Wavelet Bank
First, let’s obtain the list of the four filters using the following methods:
[dec_lo, dec_hi, rec_lo, rec_hi] = wavelet.filter_bank
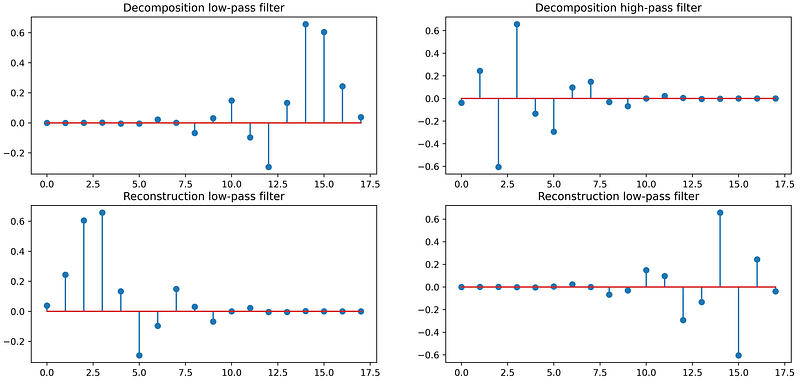
Then, we can use Matplotlib to make a stem plot for each filter.
fig, ((ax1, ax2), (ax3, ax4)) = plt.subplots(2, 2, figsize=(15,7))
ax1.stem(dec_lo)
ax1.set_title('Decomposition low-pass filter')
ax2.stem(dec_hi)
ax2.set_title('Decomposition high-pass filter')
ax3.stem(rec_lo)
ax3.set_title('Reconstruction low-pass filter')
ax4.stem(rec_hi)
ax4.set_title('Reconstruction high-pass filter')
plt.savefig('./results/filter_bank.png')
plt.show()The output looks as follows:
If you like to watch a video version of this article, please go ahead to watch it and click to subscribe for more tips.
6. More Information:
If you are interested in Python related courses on Python fundamental, Jupyter Notebook, Data Science, Wavelet Transforms, Machine Learning, and so on, welcome you to my online school — Depsim Academy.