


Visualization of Wavelet and scaling functions with PyWavelets
Wavelet Transforms (WT) or wavelet analysis is probably the most recent solution to overcome the shortcomings of the Fourier Transform (FT). WT transforms a signal in period (or frequency) without losing time resolution. In the signal processing context, WT provides a method to decompose an input signal of interest into a set of elementary waveforms, i.e. “wavelets”., and then analyze the signal by examining the coefficients (or weights) of these wavelets.
1. Applications of Wavelet Transform
Wavelets transform can be used for stationary and nonstationary signals, including but not limited to the following:
- noise removal from the signals
- trend analysis and forecasting
- detection of abrupt discontinuities, change, or abnormal behavior, etc. and
- compression of large amounts of data
- the new image compression standard called JPEG2000 is fully based on wavelets
- data encryption, i.e. secure the data
- Combine it with machine learning to improve the modelling accuracy
2. PyWavelets
PyWavelets is a free Open Source library for wavelet transforms in Python, which is released under the MIT license.
The main features of PyWavelets are that it can make wavelet transforms on 1D, 2D and nD signals, which include the following main transforms:
- Forward and Inverse Discrete Wavelet Transform (DWT and IDWT)
- Multilevel DWT and IDWT
- Stationary Wavelet Transform (Undecimated Wavelet Transform)
- Wavelet Packet decomposition and reconstruction
- Continuous Wavelet Transform
- Multiresolutiom Analysis (MRA)
3. Install PyWavelets and Required Packages
PyWavelets has dropped support for Python 3.5 and 3.6 and now supports Python 3.7–3.10. PyWavelets is only dependent on NumPy (supported versions are currently >= 1.14.6). Besides, Matplotlib are required for visualization.
From PyPI:
pip install PyWavelets matplotlib
For Anaconda Users, Anaconda has these packages installed. If you have not installed it on your PC, you can install by:
conda install -c conda-forge pywavelets matplotlib
4. Built-in Wavelet Families and Family Memebers
One can simply check and display all PyWavelets Built-in Wavelet Families and their members using the following command:
import pywat
for family in pywt.families():
    print(f'{family} family: {pywt.wavelist(family)}')
Then it returns a list as follows:
5. Plot Approximations of Wavelet and Scaling Functions
5.1. Import Required Packages
# import the required packages
import pywt
import matplotlib.pyplot as plt
5.2. Plot Discrete Wavelet and Scaling Functions
(1) Orthogonal Wavelets
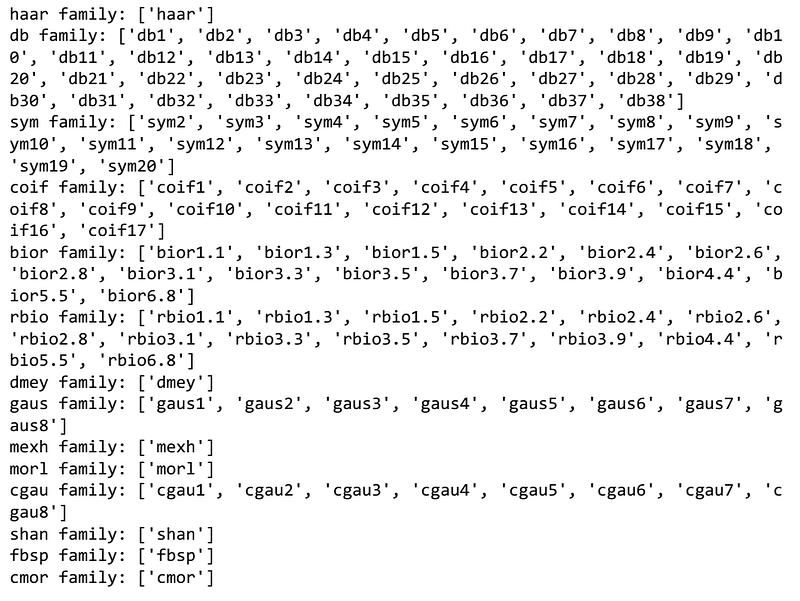
First, let’s get the approximation wavelet and scaling functions of a given wavelet and choose a level. Take ‘db5’ and level=1 for instance.
wavelet = pywt.Wavelet('db5')[phi, psi, x] = wavelet.wavefun(level=1)
Plot wavelet function:
plt.plot(x,psi)
plt.show()
It generates the following plot:
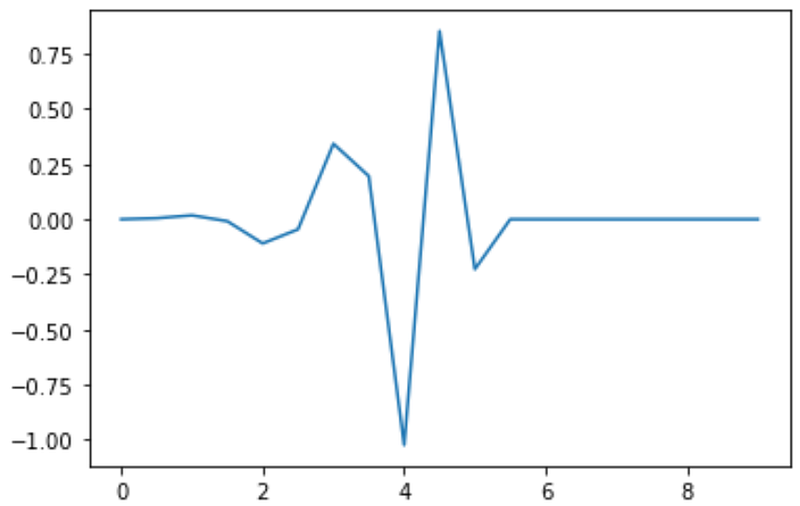
Plot scaling function:
plt.plot(x,phi)
plt.show()
The result looks as follows:
(2) Other Wavelets
For other (biorthogonal but not orthogonal) wavelets, it returns approximations of scaling function and wavelet function both for decomposition and reconstruction and corresponding x-grid coordinates.
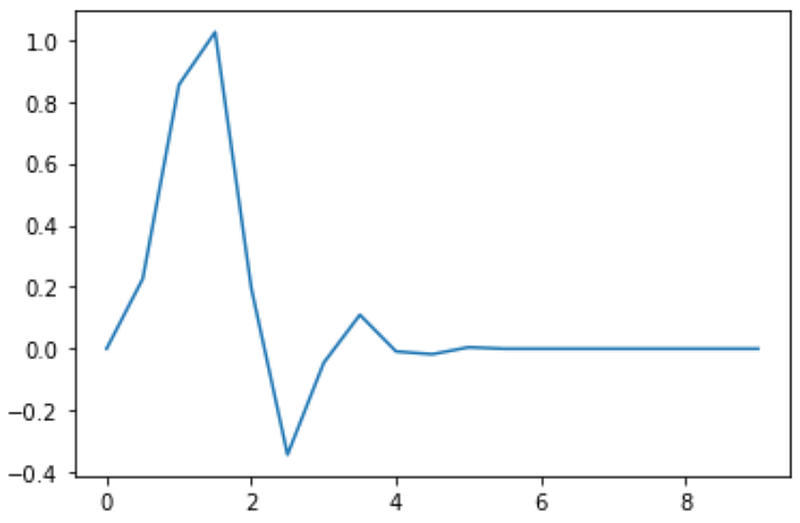
For example, let’s see wavelet ‘bior3.5’ and level=5.
biwavelet = pywt.Wavelet('bior3.5')
[phi_d,psi_d,phi_r,psi_r,x] = biwavelet.wavefun(level=5)
Visualize their functions as follows:
# Wavelet Function of decomposition
plt.plot(x,psi_d)
plt.show()
# wavelet function of reconstruction
plt.plot(x,psi_r)
plt.show()
# scaling functions of decomposition
plt.plot(x,phi_d)
plt.show()

# Scaling function of reconstruction
plt.plot(x,phi_r)
plt.show()

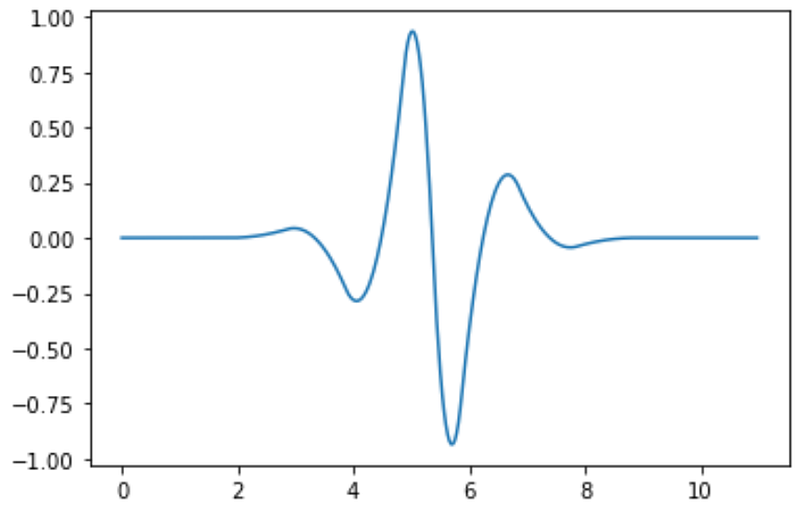
5.3. Continuous Wavelet Functions
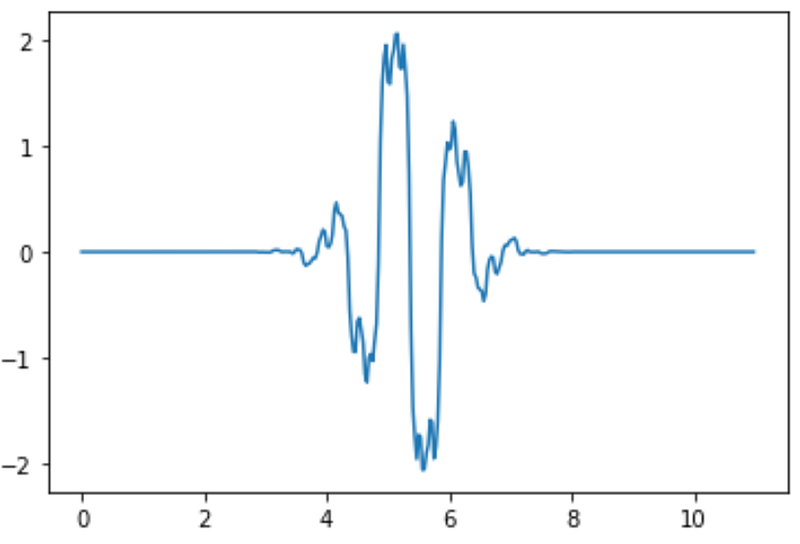
Let’s take ‘gaus2’ at level 5 for example as follows:
(1) Obtain the approximation function
W = pywt.ContinuousWavelet(‘gaus2’)
[psi,x] = Wavelet.wavefun(level=5)
(2) Plot the function
plt.plot(x,psi)
plt.show()

5.4. More Information:
If you are interested in Python related courses on Python fundamental, Jupyter Notebook, Data Science, Wavelet Transforms, Machine Learning, and so on, welcome you to my online school — Deepsim Academy .