


To create interactive widget plots using IPython’s widgets
The easiest way to get started with interactive widgets is using IPython’s widgets(ipywidgets). ipywidgets, also known as jupyter-widgets or simply widgets, are interactive HTML widgets for Jupyter notebooks and the IPython kernel.
In this post, we will talk about five basic methods to create interactive widget plots.
- Interact Function
- Interact Decorator
- Interactive Function
- Interact_manual
- Interact_manual Decorator
1. Interact Function
ipywidgets provide an interact() function, which can automatically create user interface (UI) controls for interactive data exploration and visualization.
(1) One Argument
Let’s plot a sine wave function with one-argument of A (i.e. amplitude).
Step 1: Import required packages
First, let’s import the required packages and modules.
import numpy as np
import matplotlib.pyplot as plt

from ipywidgets import interact
Step 2: Define plot function
Next, let’s define a sine plot function with one argument of amplitude A, define an array x of 32 uniformly spaced floating point values from 0 to Aπ, and define y to be the array containing the sine of the values from x.
def sinplot(A):
    x = np.linspace(0,A*np.pi,32)
    y = np.sin(x)

    # plot the sin curve
    fig,ax = plt.subplots()
    ax.plot(x, y)
Step 3: Call the interact function
When we pass this sinplot function as the first argument to interact() along with an integer keyword argument (A=2), a slider will be automatically generated and bound to the function argument.
interact(sinplot,A=2)The result looks as follows:
When you pass a positive integer-valued keyword argument of a (x=a) to interact, it generates an integer-valued slider control with a range of [−𝑎,+3∗𝑎][−a,+3∗a]. In the above example, we pass 2 to the argument of 𝐴 (i.e. 𝐴=2), thus the slider control has a range of [-2,+6] When you move the slider, the function is called and new plots will be generated.
Argument with a 2-tuple of integers
We can also pass a 2-tuple of integers (min, max) as the arguments, which will produce an integer-valued slider with those minimum and maximum values, and the default step size of 1.
interact(sinplot, A=(0,4));It produces the following plot:

Argument with a 3-tuple of integers
A third element in the tuple can be passed to change the step size. If a 3-tuple of integers is passed (min, max, step) to the arguments, the step size will be set accordingly by the value of that integers.
interact(sinplot, A=(0,8,2));# from 0 to 8 with step of 2It generates the following plot:

(2) More Arguments
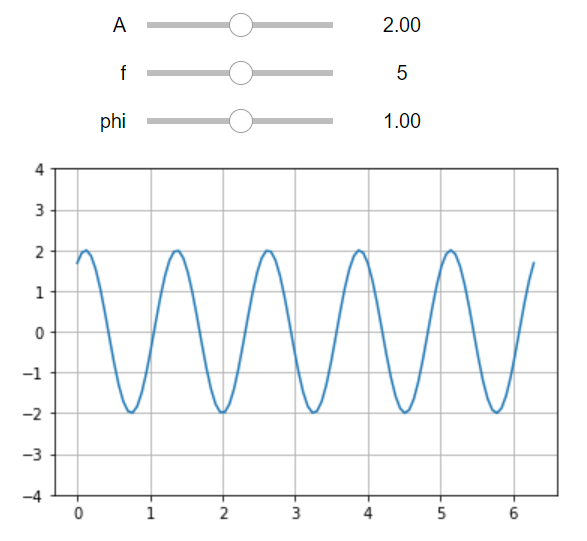
Interact is not limited to single argument functions, it can have function with multiple arguments. As follows, let’s take the following standard sine wave function with three arguments to create interactive widgets for plots.
𝑦(𝑥) = 𝐴𝑠𝑖𝑛(2𝜋𝑓𝑥+𝜑)
where:
A, the amplitude of the wave, i.e. the maximum height of the wave.
f, ordinary frequency, the number of oscillations (cycles) occur each second of time.
𝜑, phase, specifies (in radians) where in its cycle the oscillation is at t = 0.
def sinwave(A, f, phi):
    # set up plot
    fig, ax = plt.subplots(figsize=(6, 4))
    ax.set_ylim([-4, 4])
    ax.grid(True)

    # generate x values
    x = np.linspace(0, 2 * np.pi, 100)
    y = A*np.sin(x*f + phi);
    ax.plot(x,y)

interact(sinwave,A=(0, 4, .1),f=(0, 10, 1), phi=(0, 2, 0.5))
The result goes as follows:
Fixing arguments using fixed
In some case, you may explore a function using interact, but fix one or more arguments to specific values. This can be realized by using the fixed function to pass a specific value to the argument that need to be fixed.
In order to fix one or more arguments, we have to import both interact and fixed method.
from ipywidgets import interact,fixedFor example, call interact, you pass fixed(6) for phi to hold it fixed at a value of 6.
interact(sinwave,A=(0, 4, .1),f=(0, 10, 1), phi=fixed(6))
Dropdowns
Dropdown menus are created by passing a list of strings to the function. In this case, the strings are both used as the names in the dropdown menu UI and passed to the underlying Python function.
#### Color selection
def sinwave(color, A, f, phi):
    # set up plot
    fig, ax = plt.subplots(figsize=(6, 4))
    ax.set_ylim([-4, 4])
    ax.grid(True)

    # generate x values
    x = np.linspace(0, 2 * np.pi, 100)
    y = A*np.sin(x*f + phi);
    ax.plot(x,y,color)

colors = ['blue', 'red', 'orange']
interact(sinwave,A=(0, 4, .1),f=(0, 10, 1), phi=fixed(6),color=colors)
We can also pass a list of (‘label’, value) pairs to a dropdown menu, where the first items are the names in the dropdown menu UI and the second items are values passed to the arguments.
def sinwave(A, f, phi):
    # set up plot
    fig, ax = plt.subplots(figsize=(6, 4))
    ax.set_ylim([-4, 4])
    ax.grid(True)

    # generate x values
    x = np.linspace(0, 2 * np.pi, 100)
    y = A*np.sin(x*f + phi);
    ax.plot(x,y)

A = [('one', 1), ('two', 2)]

interact(sinwave,A=A,f=fixed(8),phi=fixed(6))
Dictionary value
We can also pass a dictionary (key:value) pairs instead of the list of (‘label’, value) pairs to realize the same drop.
A = {'one':1,'two':2}

interact(sinwave,A=A,f=fixed(8),phi=fixed(6))
2. Interact Decorator
Interact can also be used as a @interact decorator, which allows us to quickly define a function and turn the function into an interactive widget.
@interact(A=(0, 4, .1),f=(0, 10, 1), phi=fixed(6))

def sinwave(A, f, phi):
    # set up plot
    fig, ax = plt.subplots(figsize=(6, 4))
    ax.set_ylim([-4, 4])
    ax.grid(True)

    # generate x values
    x = np.linspace(0, 2 * np.pi, 100)
    y = A*np.sin(x*f + phi);
    ax.plot(x,y)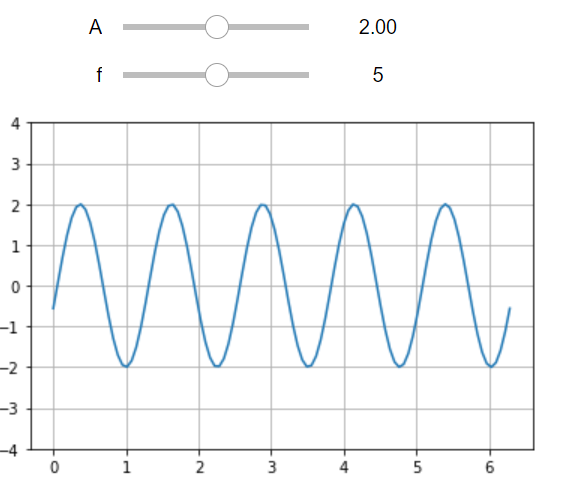
@interact(A=(0, 4, .1),f=fixed(10), phi=fixed(6),,colors
colors = ['blue', 'red', 'orange'])
def sinwave(colors, A, f, phi):
# set up plot
fig, ax = plt.subplots(figsize=(6, 4))
ax.set_ylim([-4, 4])
ax.grid(True)
# generate x values
x = np.linspace(0, 2 * np.pi, 100)
y = A*np.sin(x*f + phi);
ax.plot(x,y)

3. Interactive Function
In addition to interact, IPython provides another function, interactive(), which is useful if you need to reuse the widgets. Unlike interact, interactive returns a Widget instance rather than automatically displaying the widget.
from ipywidgets import interactive, fixed
from IPython.display import display

def sinwave(A, f, phi):
    # set up plot
    fig, ax = plt.subplots(figsize=(6, 4))
    ax.set_ylim([-4, 4])
    ax.grid(True)

    # generate x values
    x = np.linspace(0, 2 * np.pi, 100)
    y = A*np.sin(x*f + phi);
    ax.plot(x,y)
sinplot = interactive(sinwave, A=(0, 4, .1),f=(0, 10, 1), phi=fixed(6))To actually display the widgets, you can use IPython’s display function.
display(sinplot)
4. Interact_manual
The interact_manual function provides a variant of interactive() that allows us to restrict execution, so it is only done on demand. A button is added to the interact controls that allows you to trigger an execute event.
This is useful with long-lasting computations that should not run every time a widget value changes.
import ipywidgets as widgets
from ipywidgets import fixed, interact_manual

def sinwave(A, f, phi):
    # set up plot
    fig, ax = plt.subplots(figsize=(6, 4))
    ax.set_ylim([-4, 4])
    ax.grid(True)

    # generate x values
    x = np.linspace(0, 2 * np.pi, 100)
    y = A*np.sin(x*f + phi);
    ax.plot(x,y)

interact_manual(sinwave, A=(0, 4, .1),f=(0, 10, 1), phi=fixed(6));
5. Interact_manual Decorator
There is also an @interact_manual decorator which provides a button to call the function manually.
@interact_manual(A=(0, 4, .1),f=fixed(10), phi=fixed(6),,colors
colors = ['blue', 'red', 'orange'])
def sinwave(colors, A, f, phi):
# set up plot
fig, ax = plt.subplots(figsize=(6, 4))
ax.set_ylim([-4, 4])
ax.grid(True)
# generate x values
x = np.linspace(0, 2 * np.pi, 100)
y = A*np.sin(x*f + phi);
ax.plot(x,y)
6. Online Course
If you are interested in learning Jupyter notebook in details, you are welcome to enroll one of my course Practical Jupyter Notebook from Beginner to Expert.