

To demonstrate how easily use hvPlot to create most widely used plots in modern and interactive way
In the last article, we have demonstrated some prerequisite information about hvPlot, such as installation, supported data structures and plotting backends. I suggest you reading those fundamentals before moving on to read this article if you are not familiar with hvPlot.
In this article, we continue to investigate how to create interactive plots using hvPlot with focusing on the most widely used basic plots available in hvPlot, including:
- area()
- bar()
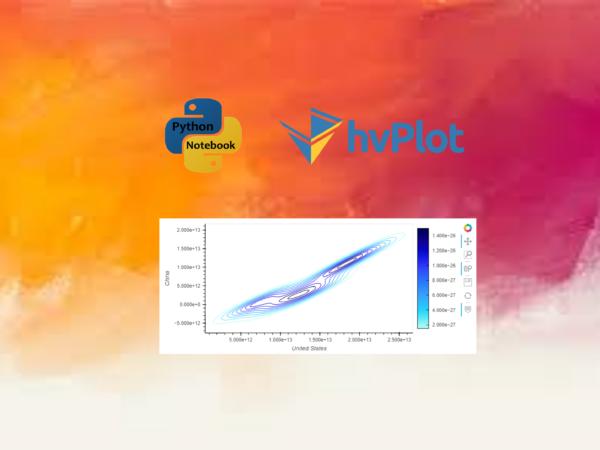
- bivariate()
- box()
- heatmap()
- hexbins()
- hist()
- kde()
- line()
- scatter()
- scatter_matrix()
- step()
- table()
- violin()
From the last article, we know that hvPlot supports different data structures of the PyData ecosystem, several plotting backends, and it also provides an easy to use pandas-like plotting API and its own API. In this article, we will use pandas DataFrame and pandas-like plotting API due to the popularity and easiness to use feature of pandas.
Besides, We will use a GDP (current US$) dataset of world top 6 economies during 1991 to 2020 to illustrate the methods. This dataset is simple and very easy to understand, and it is also used in some previous articles.
I also suggest that you’d better refer to the article of How Easily to Visualize Data with Pandas, because there are more description on different plots and most plotting syntaxes of pandas work for hvPlot.