


To Convert a Jupyter Notebook into a Standalone Web Application using Voilà
Jupyter notebook is not ideal to address non-technical audiences due to many codes, where we have to run our codes to show the results. Many codes might also distract audiences’ attention and confuse them. In addition, we don‘t want clients to know the commercial confidential information of the codes in some cases.
To solve these challenges, Voilà was released, which is able to convert Jupyter notebook to a standalone web applications and dashboards. We will talk about the following topics:
- What is Voilà
- Installation of Voilà
- Create a Plot Web App
- Test the Web App with Voilà
1. What is Voilà
Voilà is an open-source Python library, which allows you to turn the Jupyter notebook into a standalone web application and dashboards. It converts the Jupyter notebook into HTML first and then returns it to the user as a web application or dashboards, where only the outputs are displayed with all the inputs being excluded.
Voilà supports for custom interactive widgets, and it can render custom Jupyter widget libraries, including (but not limited to) bqplot, ipyleafet, ipyvolume, ipympl, ipysheet, plotly, ipywebrtc, etc. For more information about Voilà, please refer to the Document of Voilà.
2. Installation Voilà
Voilà can be installed from either pypi or conda.
from pypi:
pip install voilaor from conda-forge:
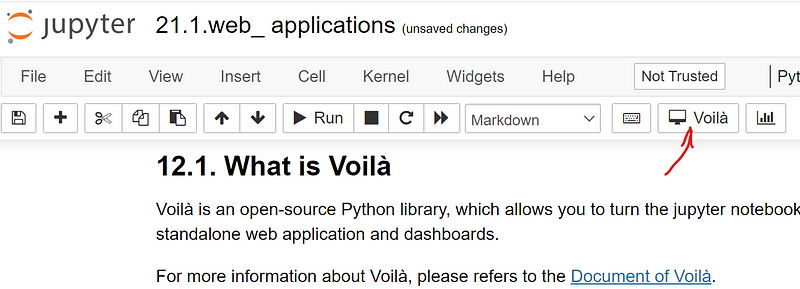
conda install voila -c conda-forgeAfter installation and restarting the Jupyter notebook, you can find there is an icon of Voilà added on the toolbar of Jupyter notebook.
3. Create Plot Web App
Let’s create a plot web app of Sin wave for example. I divide the process into the following steps.
(1) Import required libraries, packages, and methods
import numpy as np
import matplotlib.pyplot as plt
from ipywidgets import interactive, HBox,Layout,Button,GridspecLayout
(2) Choose aesthetic styles for plot
We will use the plt.style directive to choose appropriate aesthetic styles for our figures. Here we will set the ggplot style, which ensures that the plots we create use the ggplot Matplotlib style.
plt.style.use('ggplot')(3) Define the sinwave plot function
def sinwave(A, f, phi,color):
    # set up plot
    fig, ax = plt.subplots(figsize=(10,4))
    ax.set_ylim([-4, 4])
    ax.grid(True)
    ax.set_xlabel('X')
    ax.set_ylabel('Sine Wave')
    ax.set_title('Sine Wave Widget for Interactive Plot')

    # fig.canvas.toolbar_position = 'bottom' # set zoom-able and resize-able under the figure
    fig.canvas.header_visible = False # Hide the Figure name at the top of the figure

    # generate x values
    x = np.linspace(0, 2 * np.pi, 100)
    y = A*np.sin(x*f + phi);

    ax.plot(x,y,color)
(4) Create a color list
colors = ['blue', 'red', 'orange'](5) Create a widget for interactive plot
widget = interactive(sinwave,A=(0, 4, .1),f=(0, 10, 1), phi=(0, 2, 0.5),color=colors)The children of the interactive is a list, which inlcudes a dropdown color list,two floatsliders, one intslider and a plot output widget.
widget.children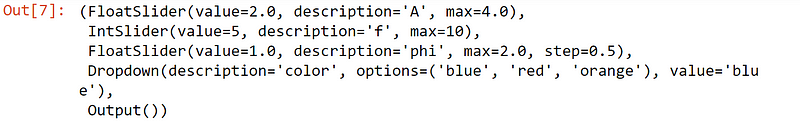
(6) Create the control widget and plot widget
controls = HBox(widget.children[:-1], layout = Layout(flex_flow='column wrap'),width='auto', height='auto')
output = widget.children[-1]
(7) Define expanded button function
def create_expanded_button(description, button_style):
    return Button(description=description, button_style=button_style, layout=Layout(height='auto', width='auto'))
(8) Using widget template
Ipywidgets have three main different layout templates used to arrange multiple widgets together. You can easily create a layout with 4 widgets arranged on 2×2 matrix using the TwoByTwoLayout widget. AppLayout widget layout template allows you to create an application-like widget arrangements, which consists of a header, a footer, two sidebars and a central pane. GridspecLayout is an N-by-M grid layout, which allows creating flexible layout definitions using an API similar to matplotlib’s GridSpec. More details about these widget templates can be referred to layout templates of ipywidgets.
In the following example, we use GridspecLayout to define a simple regularly-spaced grid, say a 10×5 layout.
# use GridspecLayout to define the widget layout
grid = GridspecLayout(10, 6, height='500px')
grid[0,:] = create_expanded_button('Sine Web Plot App', 'success')
grid[2:8, 0:2] = controls
grid[1:9, 2:] = output
grid[9,:] = create_expanded_button('\xa9 2021 Copyright Shouke Wei', 'info')

grid
The Button widget has a button_style attribute that may take 5 different values:
'primary'
'success'
'info'
'warning'
'danger'
(8) Test Web App with Voilà
Let’s create a separate new notebook named as sinplotApp for example, and then copy the above codes in the new notebook. The final codes look as follows. You can click and download this sinplotApp Jupyter notebook from my GitHub account.
## Sine Web Plot App
# Import required libraries, packages and methods
import numpy as np
import matplotlib.pyplot as plt
from ipywidgets import interactive, HBox,Layout,Button,GridspecLayout
from IPython.display import display

# set the ggplot style
plt.style.use('ggplot')

# make the plot zoom-able and resize-able

# define the sinwave plot function
def sinwave(A, f, phi,color):
    # set up plot
    fig, ax = plt.subplots(figsize=(7,4))
    ax.set_ylim([-4, 4])
    ax.grid(True)
    ax.set_xlabel('X')
    ax.set_ylabel('Sine Wave')
    ax.set_title('Sine Wave Widget for Interactive Plot')

    # generate x values
    x = np.linspace(0, 2 * np.pi, 100)
    y = A*np.sin(x*f + phi);

    ax.plot(x,y,color)


# create color list
colors = ['blue', 'red', 'orange']

# Create a widget for interative plot
# Create a widget for interative plot
widget = interactive(sinwave,A=(0, 4, 0.1),f=(0, 10, 1), phi=(0, 2, 0.5),color=colors)

controls = HBox(widget.children[:-1], layout = Layout(flex_flow='column wrap'),width='auto', height='auto')
output = widget.children[-1]
from IPython.core.display import display

# Define expanded button function

def create_expanded_button(description, button_style):
    return Button(description=description, button_style=button_style, layout=Layout(height='auto', width='auto'))

# use GridspecLayout to define the widget layout
grid = GridspecLayout(10, 6, height='500px')
grid[0,:] = create_expanded_button('Sine Web Plot App', 'success')
grid[2:8, 0:2] = controls
grid[1:9, 2:] = output
grid[9,:] = create_expanded_button('\xa9 2021 Copyright Shouke Wei', 'info')

grid
So you can click Voilà icon on the toolbar of the sinplotApp notebook that we just created above. Or run the app in a terminal locally:
voila sinplotApp.ipynbThe final result looks as follows:

4. Video Tutorial
If you are interested in a video version, you can watch the video tutorial on my Youtube channel. If this video is helpful, please subscribe my channel to support me.
5. Online Course
If you are interested in learning Jupyter notebook in details, you are welcome to enrol one of my course Practical Jupyter Notebook from Beginner to Expert.