Descripstats package add more descriptive statistics to the default describe of Pandas
For numeric data, the describe( ) function of Python Pandas library provides a very convenient method to generate a general summary table of descriptive Statistics. However, the result’s index only include count, mean, std, min, max as well as lower, 50 and upper percentiles. By default, the lower percentile is 25, the upper percentile is 75, and the50 percentile is the same as the median.
In most cases, such as writing a scientific and data analysis report, and journal paper, we need more statistic indices than these default ones, such as mean absolute deviation (mad), variance, standard error of the mean (sem), sum, skewness, kurtosis, etc. Pandas also provides methods to calculate them, but we have to write a code snippet to add them to the summary table of the describe( ) function.
In this connection, I created a Python function to easily generate the summary statistics table, which expands the indices of Pandas describe( ). For convenient use purpose, I made it into a PyPI package named descipstats, so you can easily install it and use it.
Let’s see how to use this package with a concrete real-world dataset.
1. Brief Description of the Package
The descripstats package can help add more descriptive statistics to the default describe() of Pandas, which include:
- mad: mean absolute deviation
- variance: variance
- sem: standard error of the mean
- sum: sum
- skewness: skewness
- kurtosis: kurtosis
Method:
Describe(data)
Parameters:
- data: data in NumPy array or Pandas DataFrame
Return:
- stats: the descriptive statistics summary in Pandas DataFrame
2. Install the Package
Pandas is the only dependency of this package. You can easily install it using pip as follows:
pip install descripstats
3. Use the Package
After installation, we can import it as follows:
(1) Import the packages
You can import the package with:
from descripstats import Describe
Then use Describe() directly. Or
import descripstats as ds
then use ds.Discribe()
We use the second method in this example as follows:
import pandas as pd
import descripstats as ds
(2) read dataset
We read the dataset from GitHub directly. If you are not family with the method to read dataset from GitHub directly, you can read one of my previous posts.
url = 'https://raw.githubusercontent.com/Sid-149/Life-Expectancy-Predictor-Comparative-Analysis/main/Notebooks/Life%20Expectancy%20Data.csv'
df = pd.read_csv(url,index_col=False)

# display the first rows
df.head()

(3) Display the default descriptive statistic measures of Pandas
First, let’s use the describe() function of Pandas so that you can clearly see what measures added in this package later.
df.describe()

(4) Descriptive statistic measures added by this package
Now, let’s use the function of the package by Describe(data), which uses uppercase of D. Here, df is the variable name of our imported dataset.
ds.Describe(df)

(5) Remove some of them
You can remove one or more of them you do not want through the following way.
stats = ds.Describe(df)
stats
(i) Remove one index
For example, you want to exclude mad (mean absolute deviation) in the summary table.
stats.drop('mad')
(ii) remove more than one indices
For example, remove mad, variance and sem. The inplace=False is the default, which does not change the summary table. So the mad is still there if you display the summary again. If you want to change the table, then use inplace=True.
stats.drop(['mad','variance','sem'],inplace=True)

(5) Transpose the table
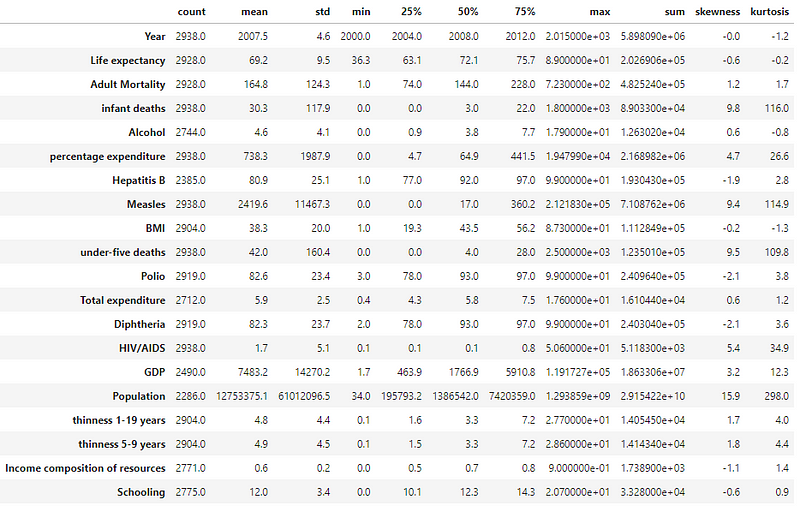
We usually use the transposed table in a thesis, a journal paper or a book, so we need to transpose the summary table. Besides, we also just roud the values to one decimal place.
stats.round(1).T.describe()

Online Course
If you are interested in learning Python data analysis in details, you are welcome to enroll one of my courses:
Master Python Data Analysis and Modelling Essentials


