

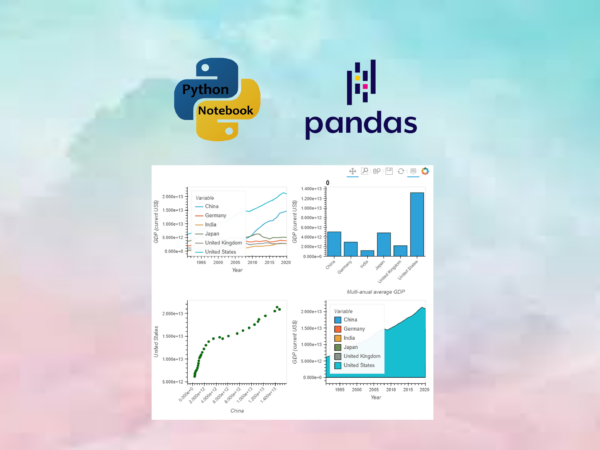
Besides static plots, we can also easily create beautiful interactive plots in pandas.
Pandas provides easy and flexible syntax and methods for data visualization. In the last article, it illustrates how easy it is to create most commonly used plots with a real-world dataset.
However, those plots are all static. Static charts are used for all purposes, while interactive plots are very appealing and helpful to visualize the data on websites and presentation slides. It is also very easy to create interactive plots with pandas using different interactive plotting backends.
In general, there are 3 convenient ways that allow us to create interactive plots directly with pandas:
- Plotly plotting backend
- Bokeh plotting backend
- HoloViews/hvPlot plotting backend
Since the most widely used basic plots have been displayed in details in the last article, this article will only display generally how to conveniently use these three methods to create interactive plots in pandas with few examples.
Summary
This article introduces 3 convenient ways that can be used to conveniently create interactive plots directly with pandas, namely plotly plotting backend, bokeh plotting backend, and holoViews/hvPlot plotting backend. In general, holoViews/hvPlot backend provides easiest methods to make all static plots of pandas interactive, while pandas-bokeh backend does not support all the plot types in pandas at the moment.