To display how to easily plot 2D and 3D interactive plots with Matplotlib and its 3D in the Jupyter notebook
1. 2D Interactive Plot
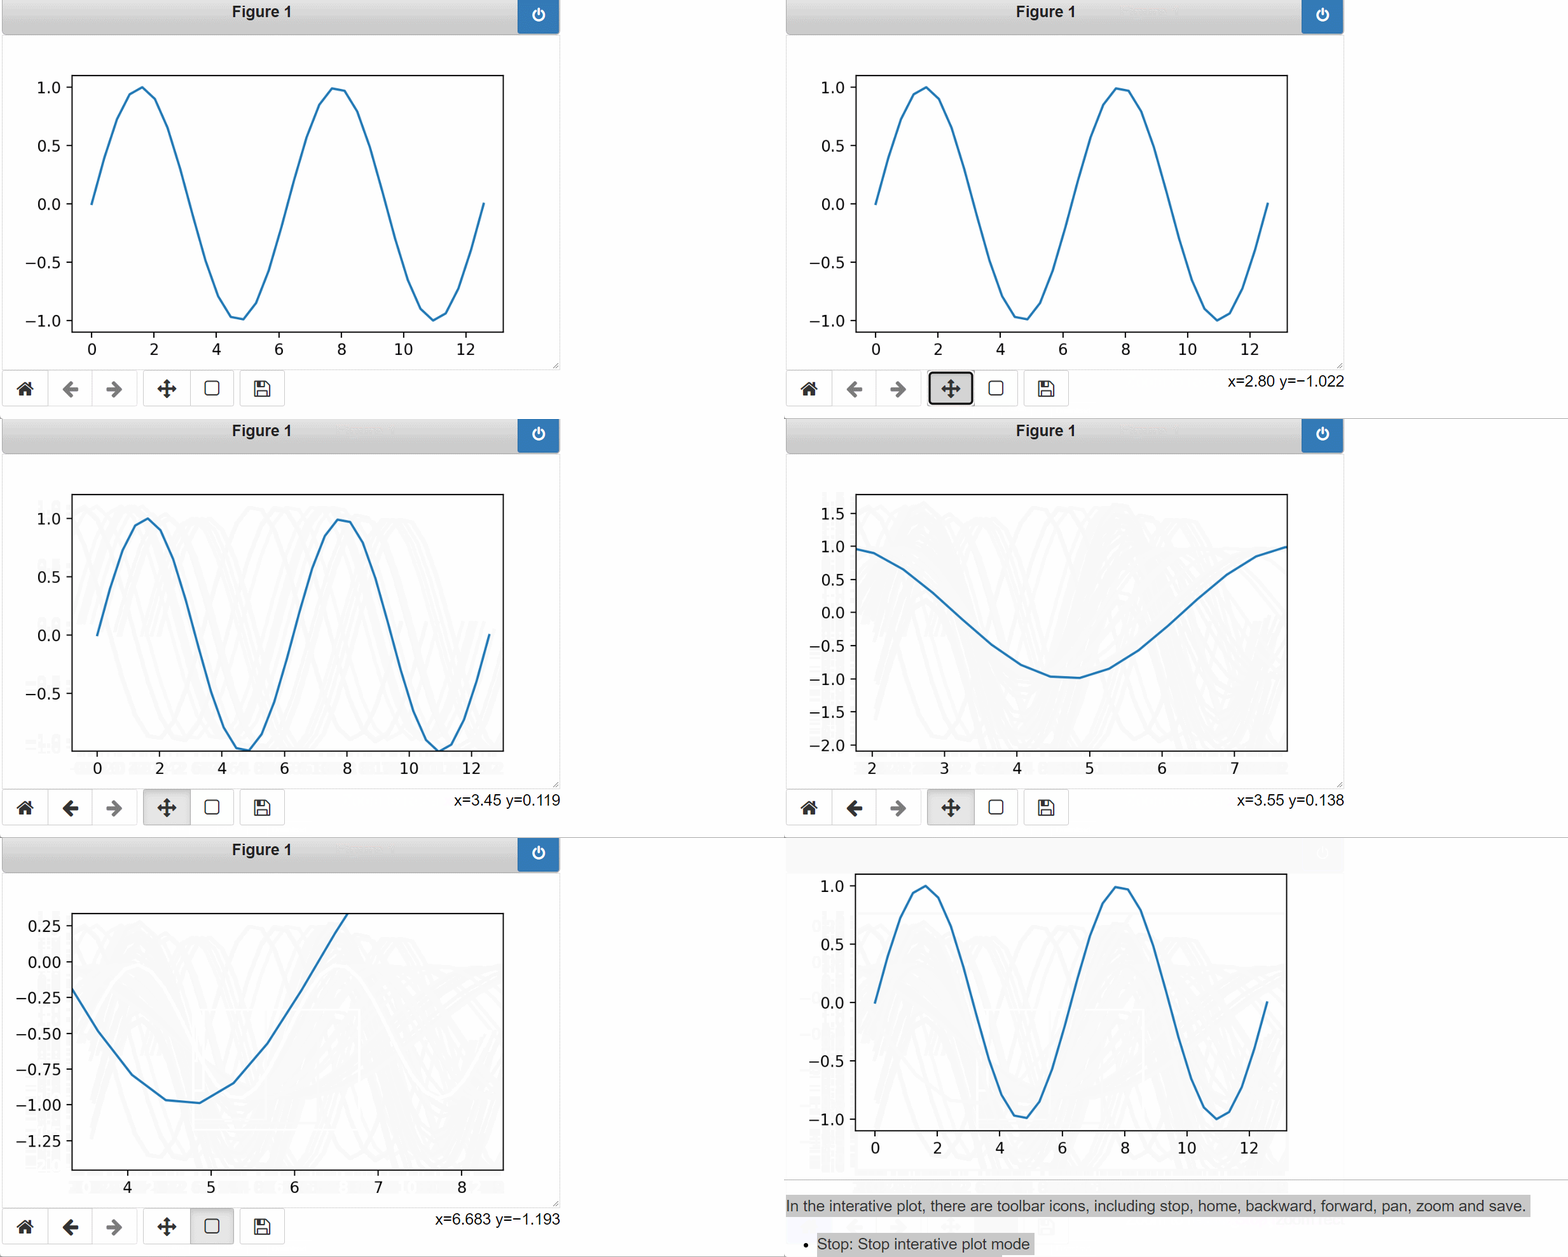
We can easily get zoom-able and resize-able plots using %matplotlib notebook magic in the notebook. It is the fastest and easiest way when you need to work with plots interactively. Let’s take a simple sine wave or sinusoid for example.
%matplotlib notebook
# or widget
import numpy as np
import matplotlib.pyplot as plt
# define an array x of 32 uniformly spaced floating point
# values from 0 to 4π
x = np.linspace(0,4*np.pi,32)
# define y as the array containing the sine values from x
y = np.sin(x)
# make a plot
fig = plt.figure(figsize=(5,3))
plt.plot(x, y)
plt.show()
The plot output looks as follows:

In the interactive plot, there are toolbar icons, including stop, home, backward, forward, pan, zoom and save.
- Stop: Stop interactive plot mode
- Home: Reset original view
- Pan: Left button pans, Right button zooms x/y fixes axis, CTRL fixes aspect
- Back: Back to previous view
- Forward: Forward to next view
- Zoom: Zoom to x/y fixes axis, CTRL fixes aspect
- Save: Save as or download plot
However, the problem is that %matplotlib notebook failed to download figures if you use Chrome. This is because Chrome removed the ability for pages to open “data:”. Thus, we should use other browsers.
2. 3D Interactive Plot
To make the 3D plots interactive, we should install another library called ipympli.e. interactive python matplotlib. To install it directly in a Jupyter notebook, we can use the following command:
!pip install ipympl
The installation process looks as follows:
Collecting ipympl
  Downloading ipympl-0.9.2-py2.py3-none-any.whl (510 kB)
Requirement already satisfied: pillow in c:\users\sigmund\anaconda3\lib\site-packages (from ipympl) (9.0.1)
Requirement already satisfied: ipywidgets<9,>=7.6.0 in c:\users\sigmund\anaconda3\lib\site-packages (from ipympl) (7.6.5)
Requirement already satisfied: ipython<9 in c:\users\sigmund\anaconda3\lib\site-packages (from ipympl) (8.2.0)
Requirement already satisfied: ipython-genutils in
.
.
.
>ipython<9->ipympl) (0.2.2)
Installing collected packages: ipympl
Successfully installed ipympl-0.9.2
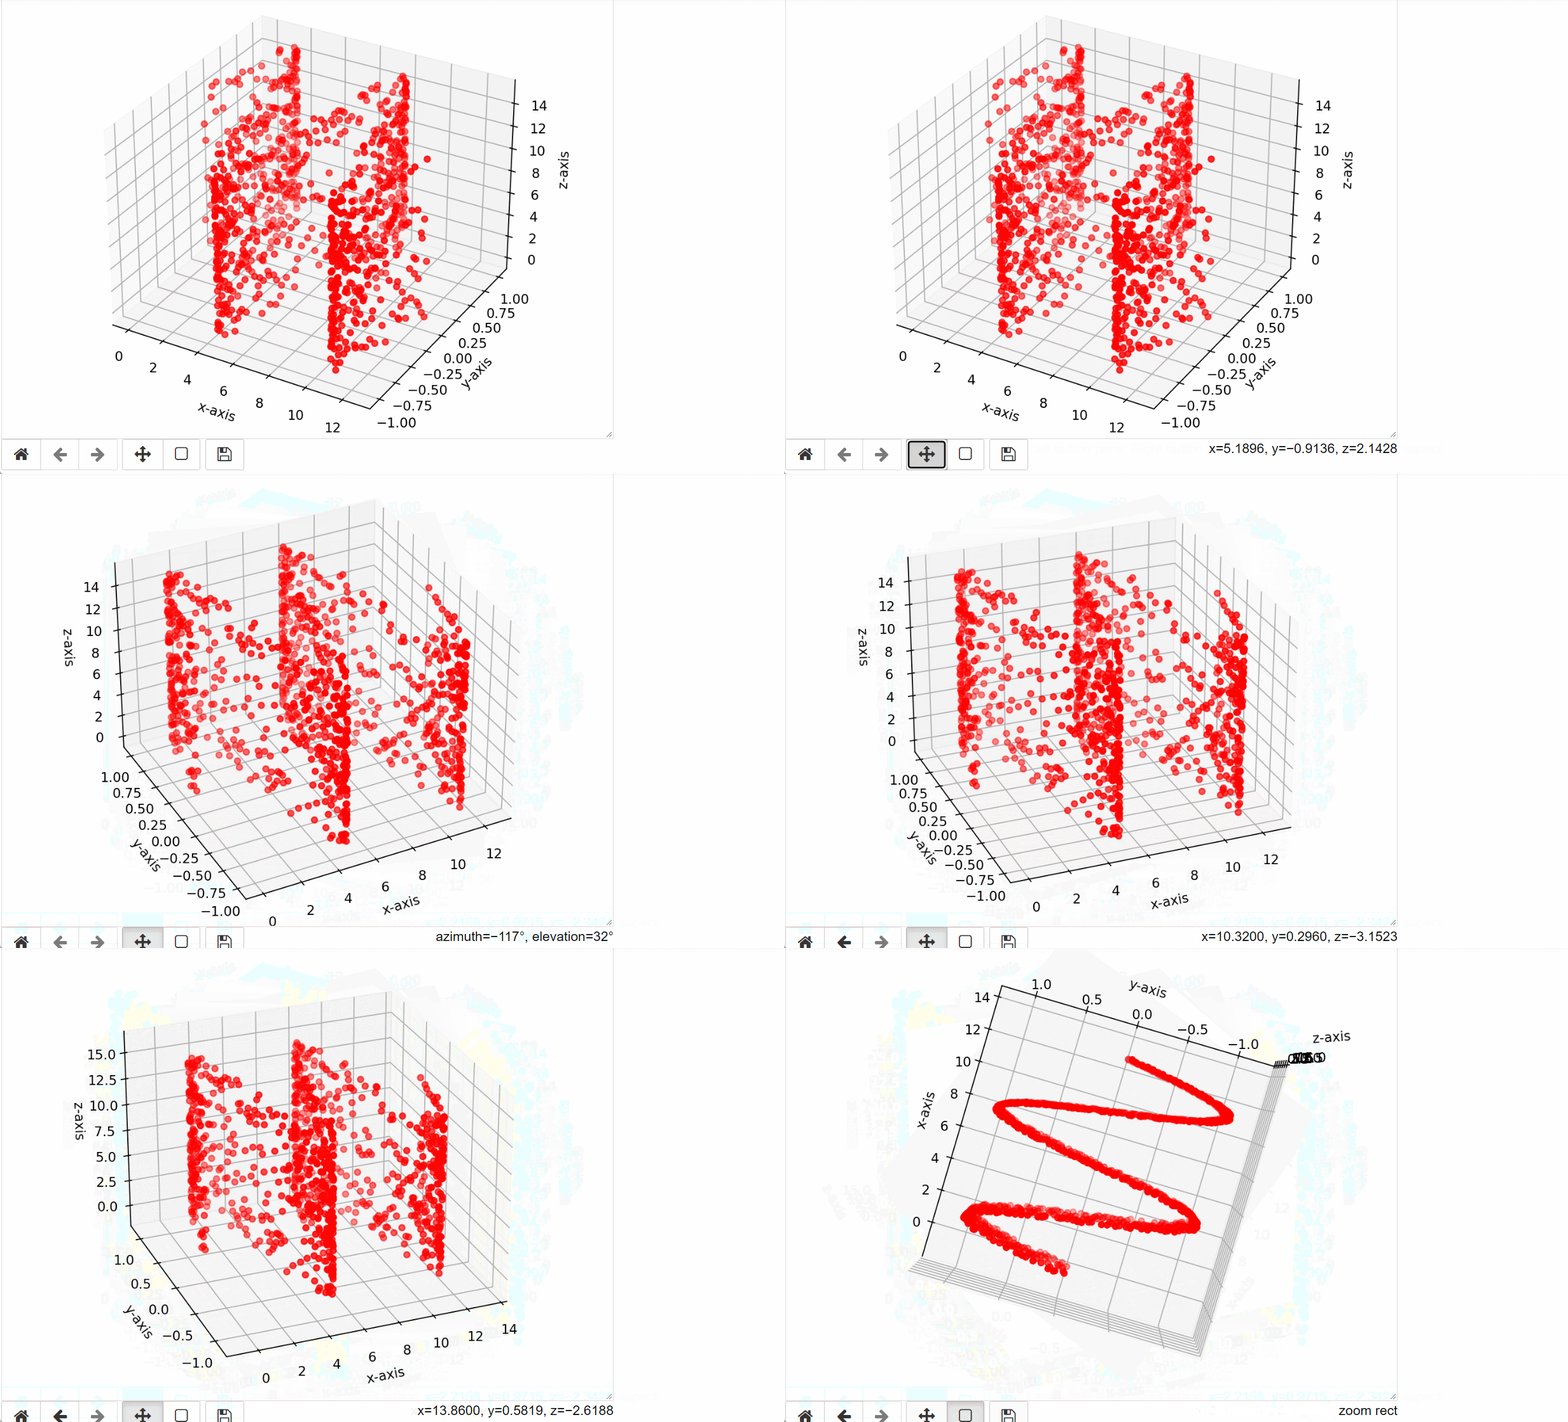
The last three lines show that ipympl-0.9.2 was successfully installed. Then we create 3d plot using matplotlib in python with the following code snippet.
# for creating a responsive plot
%matplotlib notebook

# importing required libraries
import numpy as np
from mpl_toolkits.mplot3d import Axes3D
import matplotlib.pyplot as plt

# creating random dataset
x = np.linspace(0,4*np.pi,1000)
y = np.sin(x)
z = 15 * np.random.random(1000)

# creating figure
fig = plt.figure()
ax = Axes3D(fig)

# creating the plot
plot_scatter = ax.scatter(x, y, z,color='r')

# setting title and labels
ax.set_xlabel('x-axis')
ax.set_ylabel('y-axis')
ax.set_zlabel('z-axis')

# displaying the plot
plt.show()
The outcome looks as follows:

3. Online Course
If you are interested in learning Jupyter notebook in details, you are welcome to enrol one of my course Practical Jupyter Notebook from Beginner to Expert.


